Blog
Dec
Most Expensive Cities for Commuting in the USA
Jason C. 0 comments Dallas, Data Visualization, Maps, Moving News, Seattle
What’s your daily commute like? If you live in or near a major city, traffic is probably a fact of life. Back in August, we shared how much time people of major cities waste over the course of their lives by commuting. The data was put together by EducatedDriver.org. Now, they’re back with more information about your commute; however, this time, they share how much money you spend on gas and vehicle maintenance.
Recall that the average American spends about 408 days commuting. That’s over an entire year of their life driving! In addition to spending time, people also spend money as they drive. Alex Lauderdale writes, “We did the math for nearly 100 major US cities, and found the average American will spend $108,727 on gas and vehicle maintenance costs associated with commuting while driving 173,203 miles to and from work in their lifetime. That’s enough miles to drive around the world 7 times!”
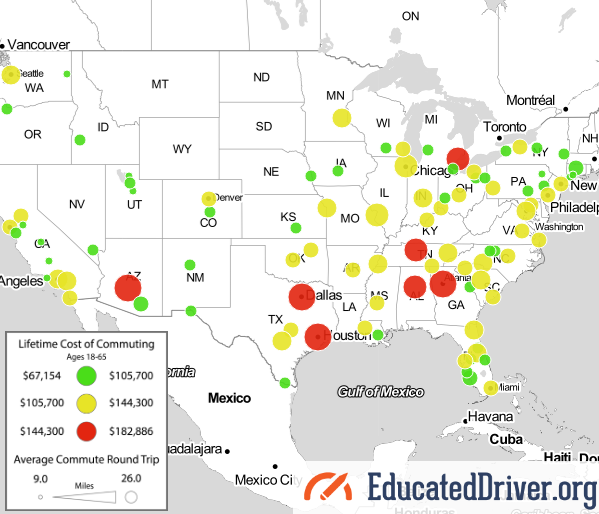
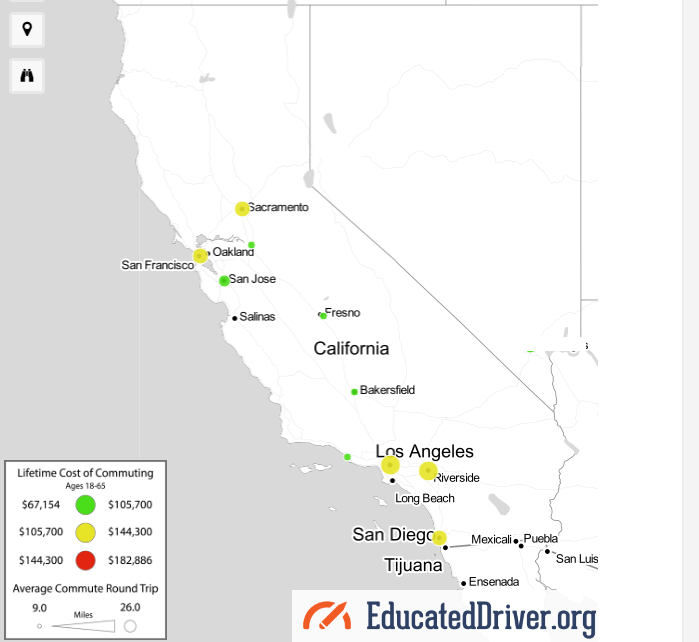
Lifetime Cost of Commuting Map

A quick glance at the map above shows this: red, yellow, and green circles. The circles represent the lifetime cost of commuting in a certain city. The red circles indicate the most expensive cities, the yellow circles indicate more of the average-costing cities, and the green circles indicate cities that are least expensive for commuting.
The lifetime cost of commuting is most in Atlanta. The average round-trip there is 26 miles and the average cost of commuting there is a whopping $182,886. Let’s take a look at some other areas.
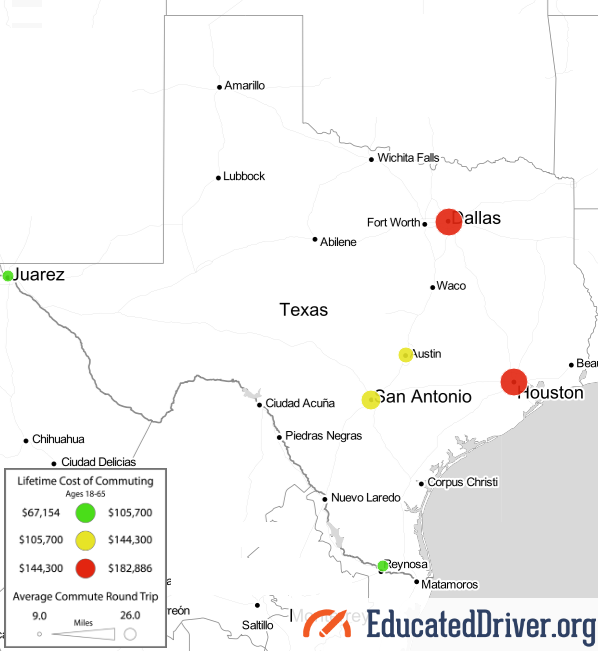
Texas has six cities on the map: Dallas, Houston, San Antonio, Austin, El Paso, and McAllen. Texas is the only state that has two large red circles which cover Dallas and Houston. Check out a photo of Texas below.
California is the state with the most cities on the map. The ten circles cover the following cities: Sacramento, Stockton, San Francisco, San Jose, Fresno, Bakersfield, Oxnard, Los Angeles, Riverside, and San Diego. We often hear about how bad the traffic can be in Los Angles; however, the city has a yellow circle. As a matter of fact, California has no red circles at all. See the photo of the state below.
Top 30 Expensive Cities for Commuting
Where are the most expensive cities for commuting? You have to click each circle to determine exactly how expensive the city is for commuting. To make better sense the map, we turned a large part of the data into a list.
Below, you’ll find the top 30 most expensive cities for commuting. As stated earlier, Atlanta is the most expensive, followed closely by Dallas, Houston, and Phoenix. Check it out as the list goes from most expensive to least:
- Atlanta, GA – $182,886
- Dallas, TX – $174,314
- Houston, TX – $174,314
- Phoenix, AZ – $162,883
- Nashville, TN – $157,168
- Detroit, MI – $148,595
- Birmingham, AL – $144,309
- Chicago, IL – $142,880
- St. Louis, MO – $142,880
- Charlotte, NC – $138,594
- Minneapolis, MN – $135,736
- Indianapolis, IL – $131,450
- Orlando, FL – $130,021
- Knoxville, TX – $130,021
- Washington, DC – $130,021
- Jacksonville, FL – $130,021
- Riverside, CA – $130,021
- Seattle, WA – $128,592
- Columbia, SC – $128,592
- Kansas City, MO – $127,163
- Memphis, TN – $127,163
- San Antonio, TX – $125,734
- Los Angeles, CA – $125,734
- Jackson, MS – $124,306
- Richmond, VA – $124,306
- Cincinnati, OH – $124,306
- Austin, TX – $122,877
- Baltimore, MD – $122,877
- Columbus, OH – $122,877
- Miami, FL – $122,877
The Methodology of the Map
How did EducatedDriver.org come up with the data used to compile the map? Alex Lauderdale writes, “For the purposes of this study, we assumed the average person starts full-time work at 18 (some people start earlier, others a bit later). We also know the average retirement age is 63 in the United States. That works out to a total of 45 years working a full-time job.”
This tells us that the data isn’t precise; however, it’s essentially as estimate based upon common knowledge such as the average retirement age and total years the average person works.
Alex continues, “From there, we operated based on the assumption most people work about 250 days per year, accounting for 2 weeks yearly vacation and time off. That adds up to a whopping 11,250 days of working/commuting over a career.”
Again, we’re seeing best estimates based upon data averages. Not everyone has exactly 2 weeks of vacation each year. Some people have more vacation than that and not everyone uses all of their vacation days.
Finally, Alex pulled data about the average round trip distances as well as how much it costs per mile to drive a vehicle. He writes, “we used data from the US Census Bureau on average daily round trip commute distances as well as data from AAA on the total cost per mile of operating a vehicle (60.8 cents per mile for the average sedan when gas, insurance, and maintenance costs are considered).”
How does your city commute compare with the rest of the country? Do you live near a red, yellow, or green circle? We’re interested in your experience and want to know if it lines up with the data! Use the comments area below to share your story.
Map photos are screenshots by RPS Relocation
Comments
Most Recent Blog Posts
 A Dallas Area Home Buyer Had to Pay $300,000 More Than Asking Price For Their New Home22 May, 2021
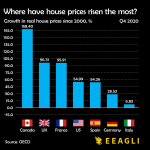
- Canada's Home Prices Have Risen 168.4% Since 2000, USA Home Prices Have Risen 54.99%01 Apr, 2021
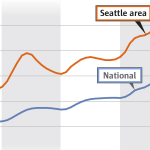
- Home Prices in Seattle Are Skyrocketing12 Mar, 2021
- Seattle Among Best Cities for Startups08 Jul, 2019
- Renters in Chicago and New York are fleeing south for Dallas24 Jun, 2019