Blog

Jun
Renters in Chicago and New York are fleeing south for Dallas
Jason C. 0 comments Dallas, Moving News
We see it time and time again: People are migrating to Texas from other areas of the United States. Specifically, we see people migrating from Seattle, Los Angeles, New York City, and Chicago. In this blog post, we’re going to cover migrating that specifically originates from Chicago. New York City, and San Antonio. Where are they going? They are moving to the Dallas-Fort Worth area! WFAA has the full story. Let’s see what they found.
Migration Data
The information comes from Apartment List. Bill Hethcock of WFAA writes, “4.8 percent of DFW apartment searches on the Apartment List site are coming from renters in New York. Another 4 percent are coming from San Antonio, and 3.6 percent are from Chicago.”
When people search for apartments to live in, especially when they aren’t in the area, that means they’re considering moving to where ever the apartment is. In this case, potential renters are looking to move to Dallas-Fort Worth.
4.8, 4, and 3.6 percent don’t seem like large numbers; however, how many major cities are there? Let’s just say there are 20 major cities. 20 times 4 (percent) is 80%. So, are we to believe that only 20% of apartment searches for Dallas-Fort Worth are happening in an around Dallas-Fort Worth? No. I’m sure most apartment searches are happening in and around the Dallas-Fort Worth area. That makes the 4.8% (etc) searches seem even larger.
Why Dallas-Fort Worth
People migrate for different reasons. For some, people move to an area to escape crime or poverty. Others move to an area because they want to raise a family and there are good schools around. With Dallas-Fort Worth, it seems like an answer of “all of the above”.
Bill Hethcock continues, “Dallas has enjoyed significant economic growth in recent years while retaining an affordable cost of living — this is an increasingly rare balance among major American metropolitan areas,” economist Chris Salviati wrote in an email. “While New York has long had one of the nation’s most dynamic economies, the cost of living is also among the nation’s highest. Chicago, on the other hand, is relatively affordable but has experienced much more stagnant economic growth.”
So there you have it. Major cities like Chicago and New York have an extremely high cost of living. Sure, people get paid more on average. But in the Dallas-Fort Worth area, new residents can get the best of both worlds: a lower cost of living coupled with a good salary. In addition, neighborhoods in and around Dallas-Fort Worth are great places to raise a family.
The trend of migration towards the Dallas-Fort Worth area is one that’s been happening for years. Because of this, businesses are thriving which allows them to hire more people. These people will spend their money within the Dallas-Fort Worth area and it will circulate within the local economy. And that’s why migration to Dallas-Fort Worth will continue in the years to come.
Featured photo by Vincent Groeneveld on Pixabay

Jun
Question: Who still has a landline phone? Short answer: a lot of people. Sure, the tide is turning against landlines in favor of cell phones. This has been happening ever since cell phones started to become popular. Now, and thanks to Overflow Data, we have the numbers of which states have the most wireless only households. Let’s check out their findings.
Map of the States
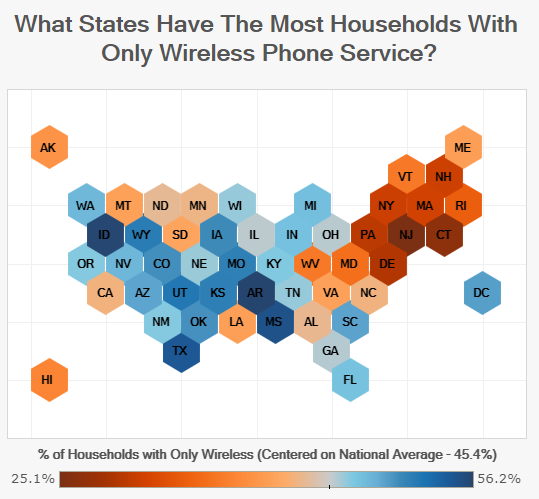
The visualization above is essentially a map of the United States. It doesn’t show the shape of the states; instead, the states are represented by colors on a moving scale from red to blue.
The red states are the ones with less wireless only households. There is no landline “telephone” within more of those homes in the blue states.
According to Chase from Overflow Data, “An increasing number of households are making the switch to only having wireless home service. The CDC tracks this in the National Health Interview Survey and estimated that at the end of 2014, 45.4% of households only have Wireless phone service.”
A few things can be surmised by looking at the map visualization. One is that the states with fewer landlines in the middle of the country. The states on the east coast have more cell phones. States like South Dakota, Louisiana, and West Virginia are the outliers. These three states lean towards having more households with landlines.
Percentages of only Wireless Service
In this section, we’re going to talk about the states in order of wireless phone service. More specifically, we’re going to list them from most wireless only to least wireless only. We’ll also include the standard error percentage that was found during the study. Let’s get started!
- Arkansas – 56.2%; SE – 2.2%
- Idaho -56.1%; SE – 2.0%
- Mississippi – 55.1%; SE – 2.2%
- Texas – 54.6%; SE – 1.1%
- Utah – 52.2%; SE – 2.0%
- Wyoming – 51.8%; SE – 1.3%
- Kansas – 51.6%; SE – 1.9%
- Missouri – 51.5%; SE – 2.1%
- Iowa – 50.7%; SE – 1.7%
- Colorado – 50.5%; SE – 1.9%
- Oklahoma – 50.4%; SE – 1.9%
- District of Columbia – 49.7%; SE – 2.2%
- South Carolina – 49.5%; SE – 2.1%
- Arizona – 49.4%; SE – 2.1%
- Nevada – 48.4%; SE – 2.0%
- Washington – 48.3%; SE – 1.9%
- Michigan – 47.8%; SE – 1.7%
- Indiana – 47.7%; SE – 2.0%
- Florida – 47.6%; SE – 1.3%
- Kentucky – 47.1%; SE – 2.0%
- New Mexico – 47.0%; SE – 2.3%
- Oregon – 47.0%; SE – 1.9%
- Tennessee – 46.6%; SE – 1.9%
- Wisconsin – 46.6%; SE – 1.9%
- Nebraska – 46.5%; SE – 1.9%
- Georgia – 45.9%; SE – 1.7%
- Ohio – 45.8%; SE – 1.6%
- Illinois – 45.7%; SE – 1.5%
- North Dakota – 43.6%; SE – 1.9%
- Alabama – 43.4%; SE – 2.3%
- Minnesota – 43.1%; SE – 1.9%
- North Carolina – 42.9%; SE – 1.7%
- California – 42.8%; SE – 0.9%
- South Dakota – 41.4%; SE – 2.0%
- Virginia – 41.1%; SE – 1.9%
- Montana – 41.0%; SE – 2.4%
- Louisiana – 40.9%; SE – 2.2%
- Maine – 40.8%; SE – 2.2%
- Alaska – 39.7%; SE – 2.2%
- Hawaii – 38.3%; SE – 1.8%
- Vermont – 37.2%; SE – 1.9%
- West Virginia – 37.2%; SE – 2.2%
- Maryland – 36.2%; SE – 1.9%
- Rhode Island – 34.6%; SE – 2.0%
- Massachusetts – 31.5%; SE – 1.8%
- New Hampshire – 31.2%; SE – 1.5%
- New York – 31.1%; SE – 1.1%
- Pennsylvania – 30.0%; SE – 1.4%
- Delaware – 29.4%; SE – 1.9%
- Connecticut – 26.7%; SE – 1.7%
- New Jersey – 25.1%; SE – 1.5%
Here are the top 5 states with households having more wireless only phone service: Arkansas, Idaho, Mississippi, Texas, and Utah. And here are the 5 states with households having less wireless service: New Jersey, Connecticut, Delaware, Pennsylvania, New York, and New Hampshire.
Landline and Wireless Phone Facts
According to Statista, 2015 was the year which half of all households had a landline and half had a cell phone only. This may come as a surprise to many people because 2015 was only a few years ago. Cell phones have taken over as the more popular choice. Landlines will likely never recover.
Do you know of anyone with a landline telephone? It’s a question still asked on my official forms that you would fill out at places like a doctors office. Landline
Felix Richter of Statista writes, “In 2004, more than 90 percent of households in the U.S. had an operational landline phone – now it’s little more than 40 percent. That’s according to data provided by the Centers of Disease Control and Prevention, which has been tracking phone ownership in the U.S. as a by-product of its biannual National Health Interview Survey since 2004.”
The percentage of households with a landline was 41.7% in 2018. By the time you’re reading this, that number is like 40% or below. Within the next decade, if the trend keeps its pace, we imagine there will only be around 20% of households with a landline.
Featured photo by Monoar Rahman Rony on Pixabay

Jun
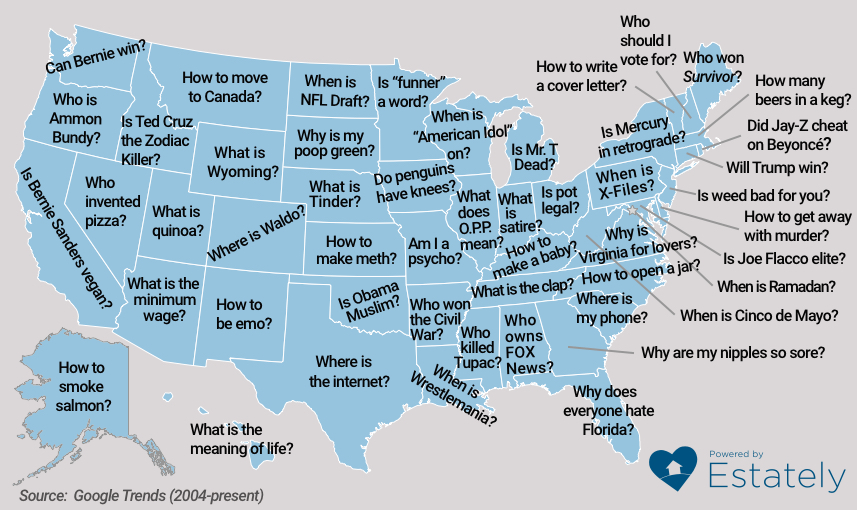
American have questions! And each state has a “most popular question”. Some of the questions are quite hilarious. Others are intriguing or downright scary. In this blog post, we’re going to examine what some of these questions are. The questions come from Google Trends and were reported by Estately.
The Funny Questions
Let’s just jump right in. In this section, we’ll cover some of the more funny questions, starting with this: “Is funner a word?”. Now, I know what you’re thinking. It’s not necessarily a “funny” question; however, it definitely related to the subject. This question comes from the residents of Minnesota.
“Is Ted Cruz the Zodiac Killer?” This is arguably a pretty funny question and topic (if you have a dark sense of humor). The Zodiac Killer is a serial killer who hasn’t been caught. Internet sleuths noticed some similarities between what’s known as the Zodiac Killer and Ted Cruz (former presidential candidate and current Texas Senator). Last year, Ted Cruz thought it would be funny to join in on the fun. He posted a tweet and wrote “Happy Halloween” with a photo of the Zodiac Killer’s symbol writing. This question comes from Idaho. See the tweet below.
Happy Halloween pic.twitter.com/jIgTaIMzep
— Ted Cruz (@tedcruz) October 31, 2018
“What is Wyoming?”. Alright, this question is being included here for one big reason: The question is coming from residents of Wyoming! Answer: the state you live in.
The Strange Questions
In this section, we’re going to go over some of the more off-ball questions people have. And remember: These questions are the most popular question in that state. Keep that in mind.
“Do penguins have knees?”. Sure, it’s a valid question! But why would the residents of Iowa be asking it? There are no penguins in Iowa! At least there aren’t in the wild. Perhaps you can find some in a zoo. If you’re wondering, the answer is yes, penguins do have knees.
“How to be emo?”. This great question comes from the residents of New Mexico. And this question is a good sign that business owners should be investing in Hot Topic and Spencer’s locations around the state. More information regarding this question doesn’t list the age of people asking the question; however, I think it’s safe to assume that this question is mostly being asked by younger teens.
The Scary Questions
In this section, we’ll talk about the more popular, scary questions. These aren’t questions like “are ghosts real”; instead, they are questions where, if you knew who was asking them, you might want to avoid them.
And here’s the first question: “Am I a psycho?”. This question comes from residents of Missouri. We hope that the answer to this is “no”.
“How to make meth?”. This question comes from the residents of Kansas. Gosh, it’s quite surprising that this is the most popular question in any state. If we were to guess, this question would be most popular in New Mexico, not Kansas. And it isn’t because meth is most popular in the state. Instead, it’s because that’s where the fictitious setting of the popular show Breaking Bad takes place.
“How to get away with murder?”. Yes, if you know someone who’s asking this question, you might want to steer clear of them. This question is the most popular question in Delaware.
“How to make a baby?”. We included this question in the scary section because if this question is the most popular one in any state, it is scary. This question comes from the residents of Kentucky. We’re hoping that this internet search educated them on this very important question.
The Smart Questions
The questions in this section are more “normal” and would seem to be questions the average person would ask. Let’s see what some of these are.
“What is quinoa?”. Good question! Quinoa is an extremely delicious and healthy. This question comes from the residents of Utah.
“How to smoke salmon?”. This is another great question and very fitting since it comes from the residents of Alaska. Salmon is abundant in the state and the people here are asking the right questions. At least, the most popular question in the state seems to be that.
“How to open a jar?”. This is another functional question and one that might be asked by more of the elderly residents of the state. Here’s a tip: if a jar is difficult to open, bang the sides of the lid with a kitchen utensil. It will help loosen it and make it easier to open. This question comes from the residents of North Carolina.
“Who won the Civil War?”. It’s important for residents of any state to ask questions like these. Wars such as the Civil War shouldn’t be forgotten. History repeats itself; however, if people remember the past, perhaps the bad parts (civil war) won’t have to be repeated. This question comes from the residents of Arkansas.
The last question we’ll cover is one that has many answers, depending on who you ask: “What is the meaning of life?”. This is a question that has been asked by residents in all cities, states, and countries for as long as humans have been alive. This great question comes from the residents of Hawaii.
We have the full map of questions for your reading pleasure. Check out the screenshot below to read the rest!
Featured photo by Gordon John on Pixabay
Map of questions is a screenshot from Estately

May
Have you ever wondered which cities are up-and-coming and trending? New York, Chicago, Miami, and Los Angeles are the largest major cities in America; however, a couple of these cities—specifically, New York, and Chicago—have a net negative population migration. NerdWallet was able to compile the internal migration data for the entire country. Some of the data, such as with New York and Chicago, may surprise you.
In this article, we’re going to talk about where people are moving from and moving to. We’ll even get into average and owning costs within the cities these people are moving from and moving to. Finally, we’ll detail the methodology that NerdWallet used to put together their information.
Featured Data and Information
Let’s start with the big winners when it comes to population moves: Tampa and Phoenix. These two cities have gone from large to major cities, partly because of the massive influx of new residents. Elizabeth Renter of NerdWallet writes, “the Tampa, Florida, and Phoenix metro areas had the highest share of out-of-state newcomers who were homeowners (41%), compared with an average of 32% among all metros analyzed”.
Tampa has a yearly net migration of 48,905. 147,503 are newcomers to the city and 98,598 people move away, on average. Phoenix, on the other hand, has a yearly net migration of 88,942. 219,938 are newcomers to the city and 130,996 people move away, on average. Clearly, there’s more movement in and out of Phoenix but Tampa has plenty of action as well.
Renting and Owning
The total cost to rent or own is an important factor in choosing to move to a certain area. What’s even more important, however, is the percentage of income needed to rent or own.
Elizabeth Renter writes, “Homeowners with a mortgage spent 18-22% of their household income on ownership costs in most of the metros examined while renters spent 30-33%. In all of the metros analyzed, the median homeowner income was more than twice the median renter income.”
If this were the only data needed, it’s clearly a better decision to own rather than rent. After all, why would someone pay 30-33% of their income on housing when they would only have to pay 18-22%?
Let’s examine some major cities where owning and renting costs the least as a percentage of total income. We can start with the Charlotte Metropolitan Area. Here it costs an average of 18% to own and an average of 29% to rent as a percentage of income. What about the St. Louis area? Here, it costs an average of 18% to own and an average of 30% to rent as a percentage of income. The Minneapolis area is another major city where people are getting their bang for their buck. There, it costs an average of 19% to own and an average of 29% to rent as a percentage of income.
Methodology in Obtaining Data
NerdWallet was able to create a table and a map based on the data they used. The data actually comes from more than one source. Information from the Home Buyer survey, the American Community Survey, the American Housing Survey, and the U.S. Census Bureau was used.
Elizabeth Renter writes, “NerdWallet’s Home Buyer survey was conducted online within the U.S. among 2,029 U.S. adults ages 18 and older by The Harris Poll from Jan. 16-18, 2019. Migration data comes from the 2012-2016 American Community Survey five-year estimates and approximates the number of people who moved for any one-year period within that period. As defined by the U.S. Census Bureau, monthly housing costs for homeowners include all mortgage, home equity loan, real estate taxes, insurance, utility and fuel payments.”
NerdWallet, therefore, used four sources to put together their comprehensive housing and migration analysis.
Lastly, let’s take a look at NerdWallet’s interactive migration map. The following major cities are included:
- Atlanta
- Baltimore
- Boston
- Charlotte
- Chicago
- Dallas
- Denver
- Detroit
- Houston
- Los Angeles
- Miami
- Minneapolis
- New York City
- Orlando
- Philadelphia
- Phoenix
- Portland
- Riverside
- San Antonio
- San Diego
- San Francisco
- Seattle
- St. Louis
- Tampa
- Washington, D.C.
Featured photo by Gordon Johnson on Pixabay
U.S. Migration map is embedded from Nerd Wallet

Apr
People are moving to Dallas! If you follow this blog, the reasons aren’t surprising. What is surprising, however, is where the largest group of new arrivals are coming from: Los Angeles. That’s right. And there’s quite a difference in culture between L.A. and Dallas. Another difference, and probably the biggest reason for this migration, is the cost of living between L.A. and Dallas. Both Nerd Wallet and the Dallas Observer reported on these new arrivals to Dallas.
People are Leaving California
There comes a point when people will no longer live in an area of high prices and lower prices are next door. In addition to people migrating from L.A. to Dallas, people are leaving Chicago and New York as well. Nerd Wallet found that Dallas had a net migration of 113,260. Of this, 280,492 were new residents to Dallas and 167,232 residents left the city. Oklahoma City was the top destination for people moving out of Dallas.
Some people, like former Congressman Pete Sessions (Dallas), worry that Dallas and Texas are becoming “Californized”. Stephen Young of the Dallas Observer writes, “Dallas has it so good in Sessions’ mind that liberals are coming here to ruin it.”
But people aren’t coming to Dallas with the main goal of instilling their values; instead, they want a better quality of life. Stephen Young continues, “Dallas’ median monthly housing cost for homeowners was $1,650 per month, about 20 percent of the region’s typical household income for those who own a house. In Los Angeles, the average home cost a homeowner $2,470 per month, about 27 percent of his or her income.”
So there you have it. Moving to Dallas from Los Angles is like getting an automatic 7% increase in income. Why pay $2,470 for housing when you only need to pay $1,650 on average?
Housing costs are worse in Los Angeles for renters. Stephen Young writes, “For renters, housing costs were a bigger burden, with the region’s $1,090 average rent costing the typical renter 28 percent of his or her income, but remained competitive with Los Angeles, where average rental costs were $1,480, or about 35 percent of household income.” Again, we’re seeing that is less expensive to live in Dallas than it is in Los Angeles.
Do you live in Los Angeles and are thinking about moving to Dallas? How much would the move cost you? Head over to our free moving quote for Dallas page to find out.
Featured photo by mohammad_hassan on Pixabay
Jan
ISP, Entertainment, & Technology Giant AT&T is Now An Apartment Landlord
Jason C. 0 comments Dallas, Moving News
AT&T is making moves in Dallas. Just 10 years after moving from San Antonio to Dallas, the technology company is purchasing the historic Interurban Building. Here’s where the story gets interesting: AT&T isn’t using the building for company operations; instead, they’re investing in the property which is a mix of residential and retail units. Dallas News covered the story and gave us more details about this purchase.
The Interurban Building
Long before AT&T came to Dallas, the Interurban Building was built. As a matter of fact, it’s been there for over 100 years.
Steve Brown of Dallas News writes, “The more than century-old brick and stone building was once the hub for North Texas’ electric railway system. It later served as a bus station with offices on the upper floors. In 2005, developers acquired the vacant historic building and converted it to loft apartments with retail on the ground floor. The building was sold by California-based Bridge National Partners, which acquired the property out of bankruptcy in 2011.”
Take a look at what the Interurban Building looked like in the 1940s below.
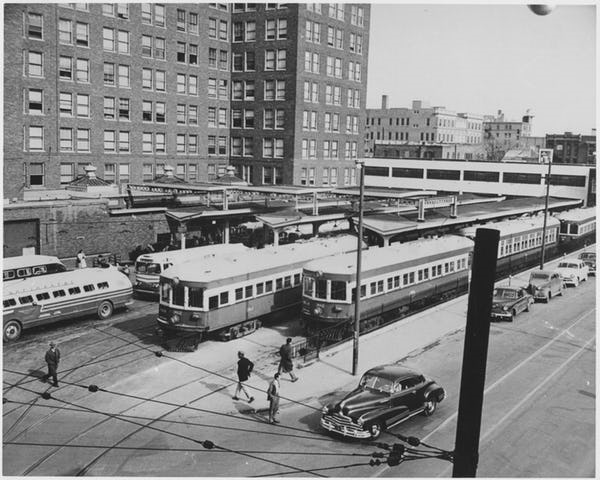
AT&T is Growing in Dallas
About 6,000 employees work at AT&Ts office complex in Dallas. Some of these employees likely already live at the Interurban Building. The purchase of the Interurban building is a further expansion for what AT&T is already currently doing.
The company has been renovating its four-block Dallas campus—Discovery District—since last year.
Steve Brown continues, “The surrounding construction includes 40,000 square feet of restaurants and retail space, a two-story food hall with balcony dining, outdoor gathering and performance areas, and a water garden.”
In total, AT&T is spending $100 million to redo and renovate the Discovery District and surrounding areas. With these renovations and the purchase of the Interurban Building, AT&T is having a great growth year in the Dallas area.
Featured photo by Wikimedia Commons
The 1940s Interurban Building photo is a screenshot by RPS Relocation
Jan
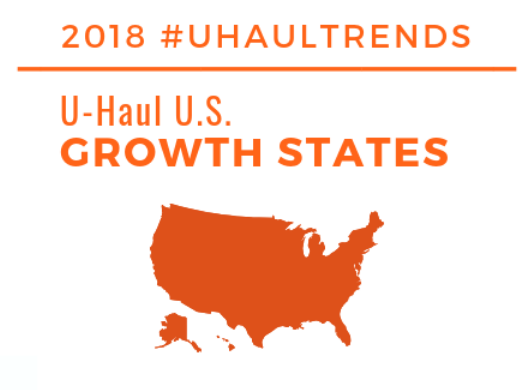
People are moving and U-Haul has the data. Are people moving within their respective states? Or, are there trends towards certain states on a large scale? U-Haul went through their records and shared their results for 2018.
A Spotlight on Texas
Texas is the grand winner when it comes to states people are moving to. As a matter of fact, this is the third year in a row Texas is the number one state people are moving to.
U-haul writes, “North Texas is truly bursting at the seams,” stated Kevin Flanagan, U-Haul Company of Northwest Dallas president. “McKinney, Frisco and the entire Dallas-Fort Worth metroplex has been growing substantially in recent years. Texas is gaining more residents than any other state. I think it is the most desirable state in which to live. Obviously, many U-Haul truck-sharing customers agree with me.”
Why is Texas gaining more residents than other states? Business opportunities are a big reason. Companies are moving to Texas and bringing their employees with them. Lower taxes is another reason.
States with high taxes—such as California—are losing residents to Texas.
How has the population migration to Texas changed since 2017? U-Haul continues, “Texas arrivals of one-way U-Haul trucks were up 5 percent compared to the state’s 2017 numbers, while arrivals accounted for 50.2 percent of all one-way U-Haul traffic in Texas to keep it the top state for netting do-it-yourself movers. Communities in and around the Houston, Dallas-Fort Worth and Austin-Round Rock metropolitan areas continued to see some of the largest influxes of U-Haul traffic in the Lone Star State.”
The Runner-up States
Florida, South Carolina, Utah, Idaho, Maryland, Vermont—these are the states people are moving to besides Texas.
U-Haul writes, “Florida ranked second for the third year in a row. South Carolina inched up one spot to No. 3, while fast-risers Utah and Idaho rounded out the top five states for growth.”
South Carolina, Utah, and Idaho aren’t staying stagnant on the list; instead, they’ve become even more popular in 2018 from the prior year.
The Losing States
Which states came in last? These are the states people aren’t moving to. As a matter of fact, people are moving away from them.
Illinois, Michigan, California, Louisiana, and Massachusetts were the big losers in 2018. U-Haul writes, “Illinois was 50th on the list for the third time in four years, outpacing No. 48 California and No. 49 Michigan for net departures among out-migration states.”
Illinois is essentially the polar opposite of Texas. Illinois is a high tax state and its balance sheet is negative with debt. Texas is a low tax state and is not drowning in debt. People want to move where the opportunities are. That’s why companies and the people they employ are moving to states like Texas and leaving states like Illinois.
The Data Tells a Story
U-Haul simply followed their own vehicles to get the data. Where are their trucks going? What states are they leaving?
U-Haul writes, “U-Haul Growth States are calculated by the net gain of one-way U-Haul trucks entering a state versus leaving that state during a calendar year. Migration trends data is compiled from more than 2 million one-way U-Haul truck sharing transactions that occur annually.”
It’s simple: More trucks entering a state than leaving the state means there’s a net gain in new residents. U-Haul is in the perfect position to compile this data because they own tens of thousands of moving trucks.
U-Haul continues, “U-Haul is the authority on migration trends thanks to its expansive network that blankets all 50 states and 10 Canadian provinces. The geographical coverage from more than 21,000 U-Haul truck and trailer sharing locations provide a comprehensive overview of where people are moving like no one else in the industry.”
The Full List of States
Read on to view the full list of states by popularity for 2018. These are the states people are moving to. Do you live in one of the top states? Note: The number in parenthesis is the ranking of the state in 2017.
- Texas (1)
- Florida (2)
- South Carolina (4)
- Utah (21)
- Idaho (14)
- Maryland (42)
- Vermont (10)
- Tennessee (5)
- New Hampshire (31)
- Maine (26)
- Delaware (18)
- Missouri (30)
- Wisconsin (20)
- Oregon (32)
- Ohio (34)
- Colorado (9)
- West Virginia (15)
- Nebraska (16)
- New Mexico (19)
- Washington, D.C. (28)
- Connecticut (8)
- Arkansas (3)
- Arizona (43)
- North Carolina (7)
- Nevada (33)
- Indiana (17)
- South Dakota (27)
- Virginia (13)
- Washington (6)
- Mississippi (23)
- Alaska (36)
- Kansas (38)
- Wyoming (22)
- Montana (25)
- Georgia (41)
- North Dakota (37)
- Minnesota (35)
- Rhode Island (39)
- New York (44)
- Oklahoma (24)
- Iowa (12)
- Alabama (11)
- New Jersey (45)
- Pennsylvania (48)
- Kentucky (29)
- Massachusetts (46)
- Louisiana (40)
- California (50)
- Michigan (47)
- Illinois (49)
Featured photo by Wikimedia Commons
U-Haul photo is a screenshot by RPS Relocation
Jan
What are the most popular destinations in major U.S. cities? Bars, restaurants, gyms—every major city has these establishments. Now, we have an idea of which ones people prefer the most thanks to Lyft. The rideshare company released their 2018 Lyftie Award Winners. The awards cover the most popular places in 45 cities. If you live in our around these cities, do the establishments look familiar?

Here’s the full list:
2018 Atlanta Lyftie Award Winners
Most Visited Bar: Dark Horse Tavern
Most Popular Concert Venue: Mercedes-Benz Stadium
Most Visited Brunch Restaurant: Altanta Breakfast Club
Most Visited Late Night Restaurant: Waffle House
Most Visited Fitness Studio/Gym: LA Fitness
Most Visited Late Night Neighborhood: Buckhead
Only In Atlanta: Ponce City Market
2018 Austin Lyftie Award Winners
Most Visited Bar: Whisler’s
Most Popular Concert Venue: Stubb’s
Most Visited Brunch Restaurant: South Congress Cafe
Most Visited Late Night Restaurant: Kerbey Lane Cafe
Most Visited Fitness Studio/Gym: Castle Hill Fitness
Most Visited Late Night Neighborhood: Rainey Street
Only In Austin: Barton Springs Pool
2018 Baltimore Lyftie Award Winners
Most Visited Bar: Max’s Taphouse
Most Popular Concert Venue: Royal Farms Arena
Most Visited Brunch Restaurant: Barcocina
Most Visited Late Night Restaurant: The Greene Turtle Sports Bar & Grille
Most Visited Fitness Studio/Gym: Planet Fitness
Most Visited Late Night Neighborhood: Uptown Towson
Only In Baltimore : Horseshoe Casino
2018 Boston Lyftie Award Winners

Most Visited Bar: Lansdowne Pub
Most Popular Concert Venue: Agganis Arena
Most Visited Brunch Restaurant: The Friendly Toast
Most Visited Late Night Restaurant: Felipe’s Taqueria
Most Visited Fitness Studio/Gym: CorePower Yoga
Most Visited Late Night Neighborhood: Southie
Only In Boston: Fenway Park
2018 Chicago Lyftie Award Winners

Most Visited Bar: Sidetrack
Most Popular Concert Venue: Douglas Park
Most Visited Brunch Restaurant: Beatrix
Most Visited Late Night Restaurant: The Vig
Most Visited Fitness Studio/Gym: XSport
Most Visited Late Night Neighborhood: Boystown
Only In Chicago: Navy Pier
2018 Cleveland Lyftie Award Winners
Most Visited Bar: Punch Bowl Social
Most Popular Concert Venue: House of Blues Cleveland
Most Visited Brunch Restaurant: TownHall
Most Visited Late Night Restaurant: Dive Bar
Most Visited Fitness Studio/Gym: Planet Fitness
Most Visited Late Night Neighborhood: East Bank Flats
Only In Cleveland: Rock & Roll Hall of Fame
2018 Charlotte Lyftie Award Winners
Most Visited Bar: Ink n Ivy
Most Popular Concert Venue: PNC Music Pavilion
Most Visited Brunch Restaurant: Tupelo Honey
Most Visited Late Night Restaurant: Gin Mill South End
Most Visited Fitness Studio/Gym: Charlotte Athletic Club
Most Visited Late Night Neighborhood: Uptown
Only In Charlotte: Epicentre
2018 Columbus Lyftie Award Winners
Most Visited Bar: Standard Hall
Most Popular Concert Venue: Ohio Stadium
Most Visited Brunch Restaurant: Forno Kitchen & Bar
Most Visited Late Night Restaurant: Union Cafe
Most Visited Fitness Studio/Gym: LA Fitness
Most Visited Late Night Neighborhood: Short North
Only In Columbus: Hollywood Casino Columbus
2018 Dallas-Fort Worth Lyftie Award Winners
Most winners in Lyft’s 2018 list were in Dallas only. No standalone business locations from Fort Worth or other area cities made the list, so it’s odd they decided to say these were he winners for all of DFW.

Most Visited Bar: Backyard Dallas
Most Popular Concert Venue: American Airlines Center
Most Visited Brunch Restaurant: Pecan Lodge
Most Visited Late Night Restaurant: Whataburger
Most Visited Fitness Studio/Gym: LA Fitness
Most Visited Late Night Neighborhood: Uptown Dallas
Only In Dallas-Fort Worth: The Statler
2018 Denver Lyftie Award Winners
Most Visited Bar: Avanti Food and Beverage
Most Popular Concert Venue: Red Rocks Amphitheatre
Most Visited Brunch Restaurant: Snooze an A.M. Eatery
Most Visited Late Night Restaurant: Lodo’s Bar & Grill
Most Visited Fitness Studio/Gym: 24 Hour Fitness
Most Visited Late Night Neighborhood: Lodo
Only In Denver: Union Station
2018 Detroit Lyftie Award Winners
Most Visited Bar: The Apparatus Room
Most Popular Concert Venue: Ford Field
Most Visited Brunch Restaurant: Dime Store
Most Visited Late Night Restaurant: Lafayette Coney Island
Most Visited Fitness Studio/Gym: Detroit Athletic Club
Most Visited Late Night Neighborhood: Greektown
Only In Detroit: The Belt
2018 Honolulu Lyftie Award Winners
Most Visited Bar: Mai Tai Bar
Most Popular Concert Venue: The Republik
Most Visited Brunch Restaurant: Scratch Kitchen
Most Visited Late Night Restaurant: Chingu
Most Visited Fitness Studio/Gym: UFC GYM
Most Visited Late Night Neighborhood: Chinatown
Only In Honolulu: Diamond Head
2018 Houston Lyftie Award Winners

Most Visited Bar: Kung Fu Saloon
Most Popular Concert Venue: NRG Stadium
Most Visited Brunch Restaurant: Snooze, an A.M. Eatery
Most Visited Late Night Restaurant: Whataburger
Most Visited Fitness Studio/Gym: LA Fitness
Most Visited Late Night Neighborhood: Midtown
Only In Houston: White Oak Music Hall
2018 Indianapolis Lyftie Award Winners
Most Visited Bar: Kilroy’s
Most Popular Concert Venue: Ruoff Home Mortgage Music Center
Most Visited Brunch Restaurant: Milktooth
Most Visited Late Night Restaurant: Brothers Bar & Grill
Most Visited Fitness Studio/Gym: LA Fitness
Most Visited Late Night Neighborhood: Wholesale District
Only In Indianapolis: MIlitary Park
2018 Los Angeles Lyftie Award Winners
Most Visited Bar: The Abbey
Most Popular Concert Venue: Hollywood Bowl
Most Visited Brunch Restaurant: Soho House
Most Visited Late Night Restaurant: In-N-Out Burger
Most Visited Fitness Studio/Gym: LA Fitness
Most Visited Late Night Neighborhood: West Hollywood
Only In Los Angeles: Santa Monica Pier
2018 Las Vegas Lyftie Award Winners

Most Visited Bar: PT’s
Most Popular Concert Venue: Downtown Las Vegas
Most Visited Brunch Restaurant: Carnival Buffet at The Rio Hotel
Most Visited Late Night Restaurant: Pho Kim Long Restaurant
Most Visited Fitness Studio/Gym: LVAC
Most Visited Late Night Neighborhood: The Las Vegas Strip
Only In Las Vegas: Caesar’s Palace
2018 Madison Lyftie Award Winners
Most Visited Bar: The Old Fashioned
Most Popular Concert Venue: The Kohl Center
Most Visited Brunch Restaurant: DLUX
Most Visited Late Night Restaurant: Red Rock Saloon
Most Visited Fitness Studio/Gym: UW Natatorium
Most Visited Late Night Neighborhood: Marquette
Only In Madison: Memorial Union Terrace
2018 Memphis Lyftie Award Winners
Most Visited Bar: B.B. King’s Blues Club
Most Popular Concert Venue: FedEx Forum
Most Visited Brunch Restaurant: Gus’s World Famous Fried Chicken
Most Visited Late Night Restaurant: Tin Roof
Most Visited Fitness Studio/Gym: Life Time Fitness
Most Visited Late Night Neighborhood: Beale Street Entertainment District
Only In Memphis: Graceland
2018 Miami Lyftie Award Winners
Most Popular Concert Venue: Hard Rock Stadium
Most Visited Brunch Restaurant: Big Pink
Most Visited Late Night Restaurant: Mango’s Tropical Cafe
Most Visited Fitness Studio/Gym: LA Fitness
Most Visited Late Night Neighborhood: South Beach
Only In Miami: Wynwood Walls
2018 Milwaukee Lyftie Award Winners
Most Visited Bar: Lakefront Brewery
Most Popular Concert Venue: Bradley Center
Most Visited Brunch Restaurant: Café Benelux
Most Visited Late Night Restaurant: Brothers Bar & Grill
Most Visited Fitness Studio/Gym: Wisconsin Athletic Club
Most Visited Late Night Neighborhood: Haymarket
Only In Milwaukee : Miller Park
2018 Twin Cities Lyftie Award Winners
Most Visited Bar: The Saloon
Most Popular Concert Venue: US Bank Stadium
Most Visited Brunch Restaurant: Union Bar & Grille
Most Visited Late Night Restaurant: Stella’s Fish Café & Prestige Oyster Bar
Most Visited Fitness Studio/Gym: LA Fitness
Most Visited Late Night Neighborhood: Downtown West
Only In Twin Cities: Mall of America
2018 New Jersey Lyftie Award Winners
Most Visited Bar: Bar Anticipation
Most Popular Concert Venue: MetLife Stadium
Most Visited Brunch Restaurant: The Cheesecake Factory
Most Visited Late Night Restaurant: Grasshopper off the Green
Most Visited Fitness Studio/Gym: Planet Fitness
Most Visited Late Night Neighborhood: Atlantic City
Only In New Jersey: SoJo Spa Club
2018 New Orleans Lyftie Award Winners
Most Visited Bar: Bacchanal Fine Wine & Spirits
Most Popular Concert Venue: New Orleans City Park
Most Visited Brunch Restaurant: Commander’s Palace
Most Visited Late Night Restaurant: Dat Dog
Most Visited Fitness Studio/Gym: City Park
Most Visited Late Night Neighborhood: Bourbon Street
Only In New Orleans: Cafe Du Monde
2018 Nashville Lyftie Award Winners
Most Visited Bar: Acme Feed & Seed
Most Popular Concert Venue: Ascend Amphitheater
Most Visited Brunch Restaurant: Biscuit Love Gulch
Most Visited Late Night Restaurant: Lower Broadway / Downtown
Most Visited Fitness Studio/Gym: Downtown YMCA
Most Visited Late Night Neighborhood: Lower Broadway / Downtown
Only In Nashville: Ryman Auditorium
2018 New York City Lyftie Award Winners
Most Visited Bar: Elsewhere
Most Popular Concert Venue: Forest Hills Stadium
Most Visited Brunch Restaurant: Smorgasburg
Most Visited Late Night Restaurant: Freehold
Most Visited Fitness Studio/Gym: Planet Fitness
Most Visited Late Night Neighborhood: Freehold
Only In New York City: The Metropolitan Museum of Art
2018 New York (Upstate) Lyftie Award Winners
Most Visited Bar: City Beer Hall
Most Popular Concert Venue: The St. Joseph’s Amphitheater at Lakeview
Most Visited Brunch Restaurant: Stella’s Diner
Most Visited Late Night Restaurant: Falley Allen
Most Visited Fitness Studio/Gym: LA Fitness
Most Visited Late Night Neighborhood: Allentown
Only In New York (Upstate): Buffalo Riverworks
2018 Orange County Lyftie Award Winners
Most Visited Bar: Baja Sharkeez
Most Popular Concert Venue: Honda Center
Most Visited Brunch Restaurant: Mutt Lynch’s
Most Visited Late Night Restaurant: Goat Hill Tavern
Most Visited Fitness Studio/Gym: 24 Hour Fitness
Most Visited Late Night Neighborhood: Newport Beach
Only In Orange County: Disneyland Park
2018 Orlando Lyftie Award Winners
Most Visited Bar: Ember
Most Popular Concert Venue: Camping World Stadium
Most Visited Brunch Restaurant: Bahama Breeze
Most Visited Late Night Restaurant: Mango’s Tropical Cafe
Most Visited Fitness Studio/Gym: LA Fitness
Most Visited Late Night Neighborhood: Wall Street Plaza
Only In Orlando: Disney Springs
2018 Ottawa Lyftie Award Winners
Most Visited Bar: The Lieutenant’s Pump
Most Popular Concert Venue: Lansdowne Park
Most Visited Brunch Restaurant: Daly’s Restaurant
Most Visited Late Night Restaurant: Heart & Crown Irish Pub
Most Visited Fitness Studio/Gym: Movati Athletic
Most Visited Late Night Neighborhood: ByWard Market
Only In Ottawa: Carleton University
2018 Philadelphia Lyftie Award Winners

Most Visited Bar: Morgan’s Pier
Most Popular Concert Venue: Wells Fargo Center
Most Visited Brunch Restaurant: Parc
Most Visited Late Night Restaurant: Pat’s King of Steaks
Most Visited Fitness Studio/Gym: Planet Fitness
Most Visited Late Night Neighborhood: Center City
Only In Philadelphia: Eastern State Penitentiary
2018 Phoenix Lyftie Award Winners

Most Visited Bar: El Hefe Scottsdale
Most Popular Concert Venue: State Farm Stadium
Most Visited Brunch Restaurant: Bottled Blonde
Most Visited Late Night Restaurant: Cold Beers & Cheeseburgers
Most Visited Fitness Studio/Gym: LA Fitness
Most Visited Late Night Neighborhood: Scottsdale Entertainment District
Only In Phoenix: Talking Stick Resort
2018 Pittsburgh Lyftie Award Winners
Most Visited Bar: Tequila Cowboy Bar & Grill
Most Popular Concert Venue: Stage AE
Most Visited Brunch Restaurant: Eat’n Park
Most Visited Late Night Restaurant: Primanti Bros.
Most Visited Fitness Studio/Gym: LA Fitness
Most Visited Late Night Neighborhood: South Side
Only In Pittsburgh: Giant Eagle Supermarket
2018 Portland Lyftie Award Winners
Most Visited Bar: White Owl Social Club
Most Popular Concert Venue: McMenamins Crystal Ballroom
Most Visited Brunch Restaurant: Tasty n Alder
Most Visited Late Night Restaurant: Voodoo Doughnut
Most Visited Fitness Studio/Gym: Multnomah Athletic Club
Most Visited Late Night Neighborhood: Buckman
Only In Portland: OHSU’s Aerial Tram
2018 Richmond Lyftie Award Winners
Most Visited Bar: Southern Railway Taphouse
Most Popular Concert Venue: Innsbrook After Hours
Most Visited Brunch Restaurant: Maple & Pine Restaurant
Most Visited Late Night Restaurant: Southern Railway Taphouse
Most Visited Fitness Studio/Gym: Gold’s Gym
Most Visited Late Night Neighborhood: The Fan
Only In Richmond: Virginia Museum of Fine Arts
2018 San Antonio Lyftie Award Winners

Most Visited Bar: Sternewirth
Most Popular Concert Venue: Yanaguana Gardens
Most Visited Brunch Restaurant: Pearl Brewery
Most Visited Late Night Restaurant: Brass Monkey
Most Visited Fitness Studio/Gym: Gold’s Gym
Most Visited Late Night Neighborhood: Tobin Hill
Only In San Antonio: Henry B. Gonzalez Convention Center
2018 Sacramento Lyftie Award Winners
Most Visited Bar: Faces Nightclub
Most Popular Concert Venue: Golden 1 Center
Most Visited Brunch Restaurant: Iron Horse Tavern
Most Visited Late Night Restaurant: LowBrau Bierhalle
Most Visited Fitness Studio/Gym: 24 Hour Fitness
Most Visited Late Night Neighborhood: Lavender Heights
Only In Sacramento : The Shady Lady Saloon
2018 San Diego Lyftie Award Winners
Most Visited Bar: Mavericks Beach Club
Most Popular Concert Venue: Valley View Casino Center
Most Visited Brunch Restaurant: Breakfast Republic
Most Visited Late Night Restaurant: Mavericks Beach Club
Most Visited Fitness Studio/Gym: 24 Hour Fitness
Most Visited Late Night Neighborhood: Gaslamp Quarter
Only In San Diego: Petco Park
2018 Seattle Lyftie Award Winners

Most Visited Bar: Optimism Brewing Company
Most Popular Concert Venue: CenturyLink Field
Most Visited Brunch Restaurant: Portage Bay Cafe
Most Visited Late Night Restaurant: Big Mario’s Pizza
Most Visited Fitness Studio/Gym: Washington Athletic Club
Most Visited Late Night Neighborhood: Capitol Hill
Only In Seattle: Seattle Center
2018 San Francisco Lyftie Award Winners
Most Visited Bar: Emporium SF Arcade Bar
Most Popular Concert Venue: Golden Gate Park
Most Visited Brunch Restaurant: Tartine Manufactory
Most Visited Late Night Restaurant: In-N-Out Burger
Most Visited Fitness Studio/Gym: 24 Hour Fitness
Most Visited Late Night Neighborhood: SoMa
Only In San Francisco: Ferry Building Marketplace
2018 San Jose Lyftie Award Winners
Most Visited Bar: The Patio
Most Popular Concert Venue: Levi’s Stadium
Most Visited Brunch Restaurant: Flames Eatery & Bar
Most Visited Late Night Restaurant: 4th St. Pizza Co.
Most Visited Fitness Studio/Gym: 24 Hour Fitness
Most Visited Late Night Neighborhood: Santana Row
Only In San Jose: Tres Gringos Cabo Cantina
2018 Salt Lake City Lyftie Award Winners
Most Visited Bar: The Sun Trapp
Most Popular Concert Venue: USANA Amphitheatre
Most Visited Brunch Restaurant: Red Iguana
Most Visited Late Night Restaurant: Beer Bar
Most Visited Fitness Studio/Gym: Gym at City Creek
Most Visited Late Night Neighborhood: Downtown Salt Lake City
Only In Salt Lake City: Powder Mountain Resort
2018 St. Louis Lyftie Award Winners
Most Visited Bar: Wheelhouse Downtown
Most Popular Concert Venue: Enterprise Center
Most Visited Brunch Restaurant: Pappy’s Smokehouse
Most Visited Late Night Restaurant: Broadway Oyster Bar
Most Visited Fitness Studio/Gym: Planet Fitness
Most Visited Late Night Neighborhood: The Grove
Only In St. Louis: The City Museum
2018 Toronto Lyftie Award Winners
Most Visited Bar: Rebel
Most Popular Concert Venue: Budweiser Stage
Most Visited Brunch Restaurant: Mildred’s Temple Kitchen
Most Visited Late Night Restaurant: Belfast Love Public House
Most Visited Fitness Studio/Gym: Myodetox Performance
Most Visited Late Night Neighborhood: West Queen West
Only In Toronto: CF Toronto Eaton Centre
2018 Tampa Lyftie Award Winners
Most Visited Bar: Franklin Manor
Most Popular Concert Venue: Raymond James Stadium
Most Visited Brunch Restaurant: The Cheesecake Factory
Most Visited Late Night Restaurant: American Social
Most Visited Fitness Studio/Gym: LA Fitness
Most Visited Late Night Neighborhood: Hyde Park
Only In Tampa: Armature Works
2018 Washington, DC Lyftie Award Winners
Most Visited Bar: El Centro D.F.
Most Popular Concert Venue: RFK Stadium
Most Visited Brunch Restaurant: Busboys and Poets
Most Visited Late Night Restaurant: Brixton
Most Visited Fitness Studio/Gym: Planet Fitness
Most Visited Late Night Neighborhood: 14th and U
Only In Washington, DC: John F. Kennedy Center for the Performing Arts
Featured photo by Wikimedia Commons
Lyftie award winners photos are screenshots by RPS Relocation

Jan
Chris Pratt is Moving
Jason C. 0 comments Moving News
Parks and Recreation, Guardians of the Galaxy, Jurassic World—Chris Pratt starred in these films and shows. He went from being homeless to becoming a Hollywood A-Lister. Now, he’s moving. And it seems he’s doing much of the moving himself. He shares a post from his Instagram.
He writes, “I love moving!! Picking up heavy things and moving them into the back of a truck was my major in college! (Full disclosure Chris Pratt did not go to a moving college but he did went to community college for a hot second). Point being… Need a dryer moved? Call Chris. Almost nobody in LA even has a truck so every time they have something to move they call me. Hey Chris, you still got that truck? “Oh hell yeah!!! Now I have a brand new truck thanks to Chevrolet !” DM me with your location and what you need moved and I will be over very soon in my new Silverado. #sponsored #ad.”
Chris Pratt Knows How to Move
His first big move was at age 19. Chris moved to Maui, Hawaii, for an interesting reason at that age: He wanted to retire. When he was 19, Chris wasn’t famous yet; as a matter of fact, he didn’t even have any money. When Chris says he moved there to retire he really meant he went there to become a beach bum. And that’s exactly what he did.
He got drunk, smoked weed, and lived out of a van, or in a tent on the beach. To cover his expenses, Chris worked in a nearby restaurant where he met an actress (Rae Dawn Chong). She got him a small role, people loved him, and the rest is history.
In his Instagram post, Chris mentions the truck he had in college. Speaking of college, he actually went to community college for only a few months before moving to Hawaii.
I know very well how popular people with trucks are in college. Students move in, out and transfer to different dorm rooms during their best years. Having a friend with a truck makes life easier! And Chris alludes to the fact that he was a go-to for moving during his short stint in college.
Seeing Chris load his own and boxes and trash bags suggests he’s still the humble guy he was in his past. He’s a Hollywood star now; but at the end of the day, he’s just like everyone else.
Have you ever had friends or family help you with a move? Did they have their own truck? Or, was a moving company like U-Haul the best option?
Featured photo is a screenshot of Chris Pratt’s Instagram by RPS Relocation
Dec
Most Expensive Cities for Commuting in the USA
Jason C. 0 comments Dallas, Data Visualization, Maps, Moving News, Seattle
What’s your daily commute like? If you live in or near a major city, traffic is probably a fact of life. Back in August, we shared how much time people of major cities waste over the course of their lives by commuting. The data was put together by EducatedDriver.org. Now, they’re back with more information about your commute; however, this time, they share how much money you spend on gas and vehicle maintenance.
Recall that the average American spends about 408 days commuting. That’s over an entire year of their life driving! In addition to spending time, people also spend money as they drive. Alex Lauderdale writes, “We did the math for nearly 100 major US cities, and found the average American will spend $108,727 on gas and vehicle maintenance costs associated with commuting while driving 173,203 miles to and from work in their lifetime. That’s enough miles to drive around the world 7 times!”
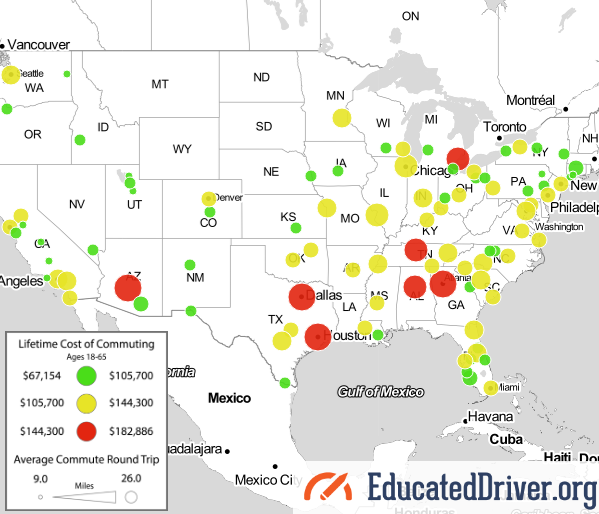
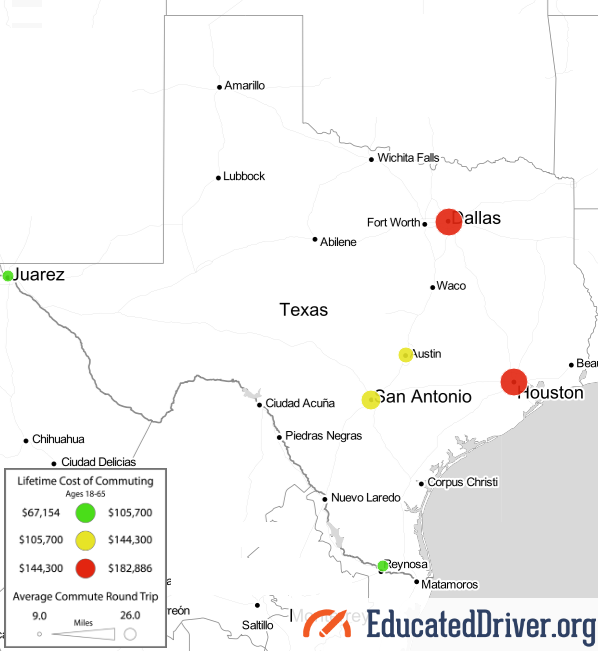
Lifetime Cost of Commuting Map

A quick glance at the map above shows this: red, yellow, and green circles. The circles represent the lifetime cost of commuting in a certain city. The red circles indicate the most expensive cities, the yellow circles indicate more of the average-costing cities, and the green circles indicate cities that are least expensive for commuting.
The lifetime cost of commuting is most in Atlanta. The average round-trip there is 26 miles and the average cost of commuting there is a whopping $182,886. Let’s take a look at some other areas.
Texas has six cities on the map: Dallas, Houston, San Antonio, Austin, El Paso, and McAllen. Texas is the only state that has two large red circles which cover Dallas and Houston. Check out a photo of Texas below.
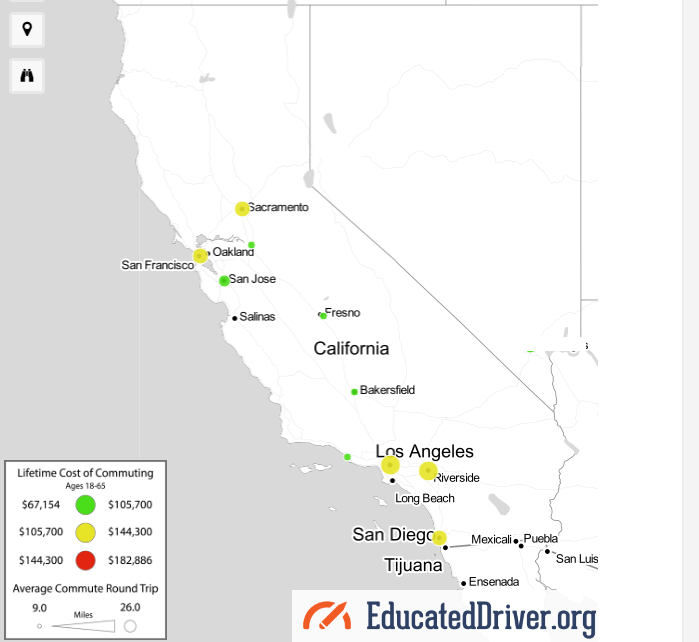
California is the state with the most cities on the map. The ten circles cover the following cities: Sacramento, Stockton, San Francisco, San Jose, Fresno, Bakersfield, Oxnard, Los Angeles, Riverside, and San Diego. We often hear about how bad the traffic can be in Los Angles; however, the city has a yellow circle. As a matter of fact, California has no red circles at all. See the photo of the state below.
Top 30 Expensive Cities for Commuting
Where are the most expensive cities for commuting? You have to click each circle to determine exactly how expensive the city is for commuting. To make better sense the map, we turned a large part of the data into a list.
Below, you’ll find the top 30 most expensive cities for commuting. As stated earlier, Atlanta is the most expensive, followed closely by Dallas, Houston, and Phoenix. Check it out as the list goes from most expensive to least:
- Atlanta, GA – $182,886
- Dallas, TX – $174,314
- Houston, TX – $174,314
- Phoenix, AZ – $162,883
- Nashville, TN – $157,168
- Detroit, MI – $148,595
- Birmingham, AL – $144,309
- Chicago, IL – $142,880
- St. Louis, MO – $142,880
- Charlotte, NC – $138,594
- Minneapolis, MN – $135,736
- Indianapolis, IL – $131,450
- Orlando, FL – $130,021
- Knoxville, TX – $130,021
- Washington, DC – $130,021
- Jacksonville, FL – $130,021
- Riverside, CA – $130,021
- Seattle, WA – $128,592
- Columbia, SC – $128,592
- Kansas City, MO – $127,163
- Memphis, TN – $127,163
- San Antonio, TX – $125,734
- Los Angeles, CA – $125,734
- Jackson, MS – $124,306
- Richmond, VA – $124,306
- Cincinnati, OH – $124,306
- Austin, TX – $122,877
- Baltimore, MD – $122,877
- Columbus, OH – $122,877
- Miami, FL – $122,877
The Methodology of the Map
How did EducatedDriver.org come up with the data used to compile the map? Alex Lauderdale writes, “For the purposes of this study, we assumed the average person starts full-time work at 18 (some people start earlier, others a bit later). We also know the average retirement age is 63 in the United States. That works out to a total of 45 years working a full-time job.”
This tells us that the data isn’t precise; however, it’s essentially as estimate based upon common knowledge such as the average retirement age and total years the average person works.
Alex continues, “From there, we operated based on the assumption most people work about 250 days per year, accounting for 2 weeks yearly vacation and time off. That adds up to a whopping 11,250 days of working/commuting over a career.”
Again, we’re seeing best estimates based upon data averages. Not everyone has exactly 2 weeks of vacation each year. Some people have more vacation than that and not everyone uses all of their vacation days.
Finally, Alex pulled data about the average round trip distances as well as how much it costs per mile to drive a vehicle. He writes, “we used data from the US Census Bureau on average daily round trip commute distances as well as data from AAA on the total cost per mile of operating a vehicle (60.8 cents per mile for the average sedan when gas, insurance, and maintenance costs are considered).”
How does your city commute compare with the rest of the country? Do you live near a red, yellow, or green circle? We’re interested in your experience and want to know if it lines up with the data! Use the comments area below to share your story.
Map photos are screenshots by RPS Relocation
Most Recent Blog Posts
 A Dallas Area Home Buyer Had to Pay $300,000 More Than Asking Price For Their New Home22 May, 2021
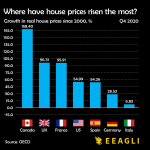
- Canada's Home Prices Have Risen 168.4% Since 2000, USA Home Prices Have Risen 54.99%01 Apr, 2021
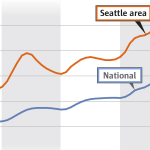
- Home Prices in Seattle Are Skyrocketing12 Mar, 2021
- Seattle Among Best Cities for Startups08 Jul, 2019
- Renters in Chicago and New York are fleeing south for Dallas24 Jun, 2019