Blog

Nov
A Majority of Americans Say Renting is More Affordable Than Owning a Home
Jason C. 0 comments Moving News
Is it better to rent or buy a home? It’s a simple question; however, there are many factors involved. Your situation is different from a great number of people. Income and age play a role in answering that question. Interest rates and location also play a role. Near term and long term goals have to be taken into consideration. Will you be in the area for a year or two? Or will you plant your feet for a decade or more? Numerous organizations—Freddie Mac, Forbes, and others—have studied this age-old question.
Let’s take a deeper look at the findings of Freddie Mac and Forbes.
Current Surveys and Research
Freddie Mac—otherwise known as the Federal Home Loan Mortgage Corporation—commissioned Harris Poll to conduct a survey of people in the housing market. The survey was conducted online from August 13-15, 2018. This is the second such survey that was conducted this year (the first being from January 30-February 1, 2018). This recent survey took the pulse of 4,040 people over the age of 18. It also included 1,059 renters. Let’s read some of the results.
“According to the survey, 78 percent of renters believe renting is more affordable than owning – up a stunning 11 points from just six months ago in February 2018. This is the case even as the majority of renters (66 percent) reported difficulty affording their rent at some point over the past two years. The survey found nearly 9 in 10 renters employed in the essential workforce, such as health care and education, had significant difficulty affording the rent over the past two years.”
The fact that most renters believe mortgages are most expensive shouldn’t be surprising. What is surprising, however, is the fact that this belief jumped by 11 points in the past six months! Rising interest rates may be to blame. After all, the 30 Year Mortgage Rate jumped from 3.95% in January to 4.86% in November 2018. If mortgage rates continue to rise homes will become less affordable; however, renters will feel the squeeze too.
Best Cities for Renting or Owning
There are certain areas around the United States where it’s better to rent. On the other hand, there are places where it’s better to own. Forbes took a magnifying glass to this issue and found out where these cities are.
Amy Dobson included a visualization of rent gaps in the 33 largest metropolitan statistical areas. See it below.
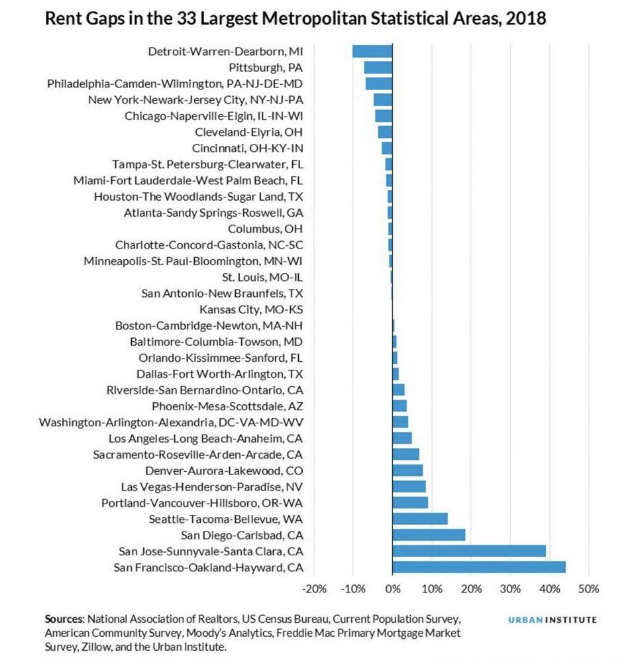
Amy writes, “So what does this chart mean? The numbers listed here are percentage points—so for the San Francisco example, the difference between the percentage of salary a renter would spend versus a buyer is about 45 percentage points difference. The chart shows percentages of income. Looking at San Francisco, a buyer would have to spend 79.68% of the median income on monthly housing payments whereas a renter would spend only 35.66% of median income. Of course, most people aren’t spending nearly 80% of their income on housing (let’s hope not), but the statistic is a useful way to compare rents versus mortgage payments just to see how big a jump it takes to become a homeowner in some of the largest cities in America.”
This means the cities at the top of the visualization are the ones where it’s cheaper to rent a home. The cities at the bottom of the visualization are the ones where it’s cheaper to have a mortgage.
Income Required for a Mortgage in Cities
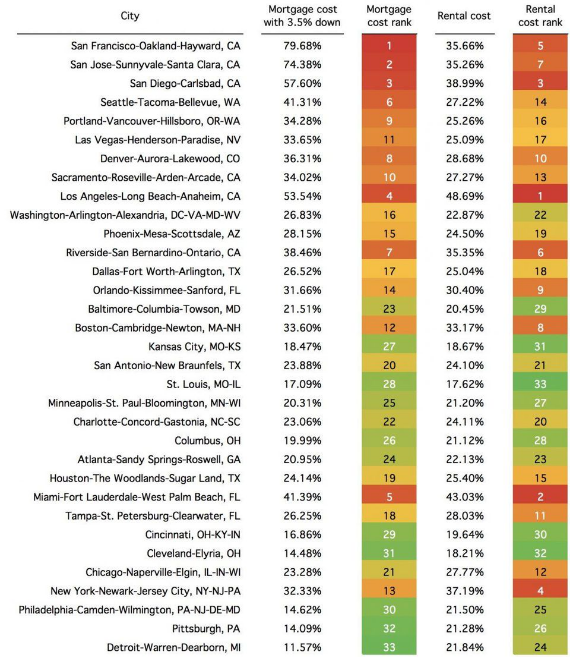
Prices of the housing market are vastly different depending on which area of the country to you live. For example, buying homes is more expensive in San Diego than buying a home in Pittsburgh. Forbes listed in the 33 most expensive major cities for having a mortgage. Here they are in order:
- San Francisco, CA
- San Jose, CA
- San Diego, CA
- Los Angeles, CA
- Miami-Fort Lauderdale, FL
- Seattle, WA
- Riverside, CA
- Denver, CO
- Portland, OR
- Sacramento, CA
- Las Vegas, NV
- Boston, MA
- New York, NY
- Orlando, FL
- Phoenix, AZ
- Washington, DC
- Dallas-Fort Worth, TX
- Tampa, FL
- Houston, TX
- San Antonio, TX
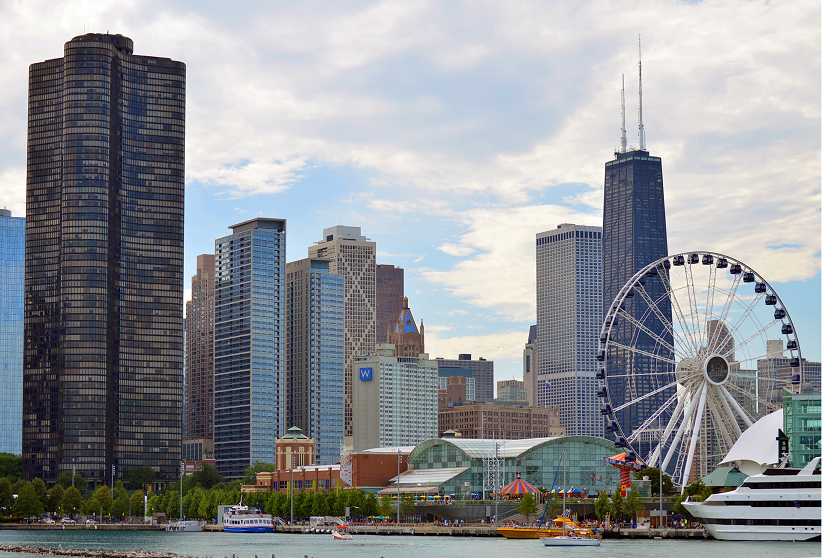
- Chicago, IL
- Charlotte, NC
- Baltimore, MD
- Atlanta, GA
- Minneapolis, MN
- Columbus, OH
- Kansas City, KS
- St. Louis, MO
- Cincinnati, OH
- Philadelphia, PA
- Cleveland, OH
- Pittsburgh, PA
- Detroit, MI
The cities listed above are in order based on mortgage cost rank. To better understand their placement, see the full visualization below. Amy also writes the chart below “shows the share of median income each city would require to buy a home. Researchers assumed a thirty-year mortgage, 3.5% down payment, 4.57% interest rate and property tax and insurance rate at 1.75% of the home’s value.”
In addition to the cost of mortgages, the chart also lists cities where it’s most expensive to rent. Los Angeles is the most expensive city to rent a home in. From the list, St. Louis is the least expensive city for renters. See more below.
Feature photo by David Jakab on Pexels
Forbes rent gaps photo and cost of mortgages photo are screenshots by RPS Relocation

Oct
Uhaul Prices Are Wildly Different Between Dallas and San Francisco
Jason C. 0 comments Dallas, Moving News

Prices for the same goods and services are not normally far apart; however, prices in some areas of the country are vastly more expensive than elsewhere. Case in point: The cost of living in California is generally more than it is in Texas. This is true for home prices, child care, medical care, and even the price of renting a Uhaul.
Uhaul prices are vastly different in the two states, actually. KXAN—a Texas news outlet—wanted to dig a little deeper regarding this disparity in their article “Why it’s 4x as much to rent moving truck from CA to TX than reverse“.
Examining the Prices
You can already see from the article title that prices for Uhaul rentals are more expensive in California. Chris Davis—writer of the article—shared that KXAN used Uhaul’s online estimate tool to determine price differences between renting a vehicle from San Francisco to Austin, and back.
Chris writes, “The cost to get a 26-foot truck (enough to move a house full of stuff) to San Francisco from here is $1,150; the reverse trip costs close to four times as much, at $4,380. The cost from Los Angeles to Austin is almost five times as much.” These prices are a factor to people considering a move to Los Angeles from Austin or from Austin to Los Angeles. It’s the same factor as with people moving from San Francisco to Dallas, as shown above.
When we checked on October 29th, 2018 here’s what the prices looked like:
San Francisco to Dallas
- 10 foot truck: $2,031.00
- 15 foot truck: $2,138.00
- 20 foot truck: $3,206.00
- 26 foot truck: $4,275.00
Dallas to San Francisco
- 10 foot truck: $974.00
- 15 foot truck: $1,026.00
- 20 foot truck: $1,128.00
- 26 foot truck: $1,282.00
We were able to determine that prices for Boston, MA, which is roughly as far away from Dallas as San Francisco (Boston is 1,768 miles away vs. San Francisco at 1,732 miles away), are much cheaper. Currently a 26 foot UHaul truck from Boston to Dallas is $1,797 or $2,478 less expensive than moving to Dallas from San Francisco with the same UHaul truck.
Why is there such a difference in prices? KXAN reached out to Uhaul for an explanation. They didn’t get a breakdown; however, KXAN received an indication why there are such large price differences. Chris writes, “U-Haul did not provide anyone for an interview about the price difference but told KXAN in an emailed statement that supply and demand plays a big role in how much it costs to get from place to place.”
I suppose the question is this: Why is the demand so high for Californians to move to Texas? Texas Senator Ted Cruz thinks he has the answer.
Ted Cruz’s Theory and Migration of the California Population

Senator Cruz is currently running for reelection in Texas. His opponent, Robert Francis “Beto” O’Rourke, is advocating for policies similar to those that can be found in California. Cruz, on the other hand, wants to preserve many of the policies that Texas currently has as well as move in a more conservative direction.
Senator Cruz is “advocating for low taxes and low regulation, comparing Texas to California, when he said the Golden State is “hemorrhaging population”. It’s widely known that the cost of living is higher in California, taxes are higher, and there is more regulation on businesses and markets.
Whatever the motive for UHaul’s pricing, the official numbers do prove people are leaving from California and migrating to Texas. Chris writes, “Texas gained more than 1,000 people per day again last year, according to U.S. Census Bureau statistics released at the end of 2017, a population gain of 1.4 percent. Most of those were what the agency calls a “natural increase” — babies being born — but 189,580 people migrated here, a total of 79,163 from other states. California, meanwhile, lost a net of 138,195 people to other states last year, though international migration still boosted the state’s overall population.”
It’s not just Texas either. When we look at UHaul prices for moving away from the bay area to cities in a similar distance away from San Francisco we see similar pricing for renting their trucks. Here are prices and distances for other cities in Mid-America roughly the same distance from San Francisco.
26 foot UHaul truck
- Kansas City, MO (1,803 miles away): $4,277.00
- Oklahoma City, OK (1,627 miles away): $4,100.00
- Omaha, NE (1,665 miles away): $4,245.00
- Minneapolis, MN (1,974 miles away): $3,671.00
Perhaps Ted Cruz is right and high taxes and a high cost of living are a couple reasons why people are moving from California to Texas and why the cost of moving via UHaul out of San Francisco is so expensive. However, the data seems to show that just like living in San Francisco, leaving it will cost you a lot, no matter when you’re going.
Have you ever rented a vehicle from Uhaul? If so, head over to our reviews page and rate them! We’re curious what you have to say.
Featured photo by Bruce Mars and highway vehicles photo by Markus Spiske on Pexels

Oct
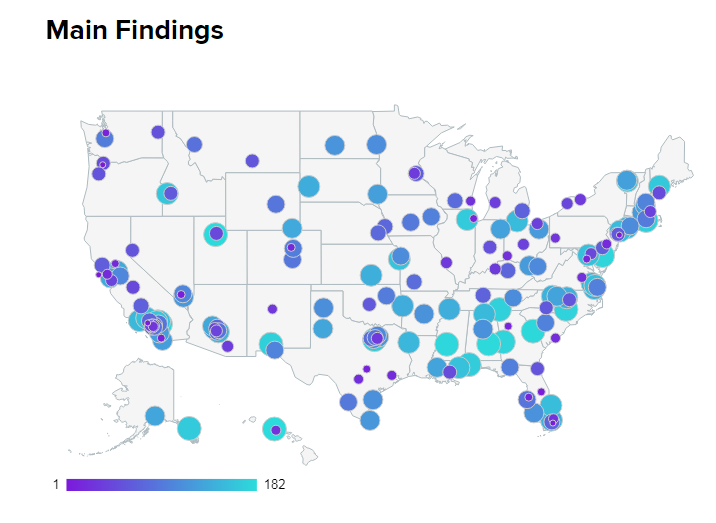
Some cities are better than others when it comes to food. More specifically, some cities are better for “foodies”. Foodies are those who explore new flavors and learn about different types of foods. WalletHub put together a comprehensive list of the best cities in America for foodies. They ranked the top 182 cities, to include the 150 most populous. Let’s explore some of these cities more in detail.
The Top 25 Cities
Topping the list is Portland, Oregon. Portland is well known as a “hipster haven” whose residents reach for the authentic. That includes food. Voodoo Donuts, Moonstruck Chocolates, Salt & Straw Ice Cream—theses are some of the food establishments Portland is known for.
The top 35 cities are as follows:
- Portland, OR
- San Francisco, CA
- Miami, FL
- New York, NY
- Los Angeles, CA
- Orlando, FL
- Las Vegas, NV
- Seattle, WA
- San Diego, CA
- Austin, TX
- Atlanta, GA
- Tampa, FL
- Chicago, IL
- Denver, CO
- Washington, DC
- Sacramento, CA
- Philadelphia, PA
- Houston, TX
- Oakland, CA
- Charleston, SC
- San Antonio, TX
- Cincinnati, OH
- Richmond, VA
- Milwaukee, WI
- Fort Lauderdale, FL
- Honolulu, HI
- Pittsburgh, PA
- Santa Ana, CA
- Albuquerque, NM
- St. Louis, MO
- Dallas, TX
- Rochester, NY
- Louisville, KY
- Minneapolis, MN
- Tucson, AZ
California and Texas: The States for Foodies
Of the 182 best cities for foodies, Califonia has 29 of them and Texas has 16. Granted, those two states are the two largest in the country, population wise. California is known for In-N-Out and avocado toast while Texas is known for Texas BBQ, Tex-Mex, chicken fried steak, and Texas chili. These famous food options are extremely simplified and one can find all types of lesser-known delights in these states and others.
While some Texans won’t be surprised at how well Austin and Houston ranked, they might be confused by Dallas ranking #31 on the list well after San Antonio and even lower than Albuquerque, NM. Ouch.
How These Cities Were Chosen
Adam McCann writes, “In order to determine the best and cheapest local foodie scenes, WalletHub compared 182 cities — including the 150 most populated U.S. cities, plus at least two of the most populated cities in each state — across two key dimensions, “Affordability” and “Diversity, Accessibility & Quality.”
Having these dimensions is important for a few reasons. With affordability, it was important for WalletHub that the food be accessible to the general population. For example, not everyone can afford a $100 meal, even if the taste is out of this world. Affordability doesn’t negate the lack of quality; instead, having affordable, quality food strikes a balance. The diversity of food within a city touches on the exploratory aspect of a city being known as a foodie haven.
Other Considerations
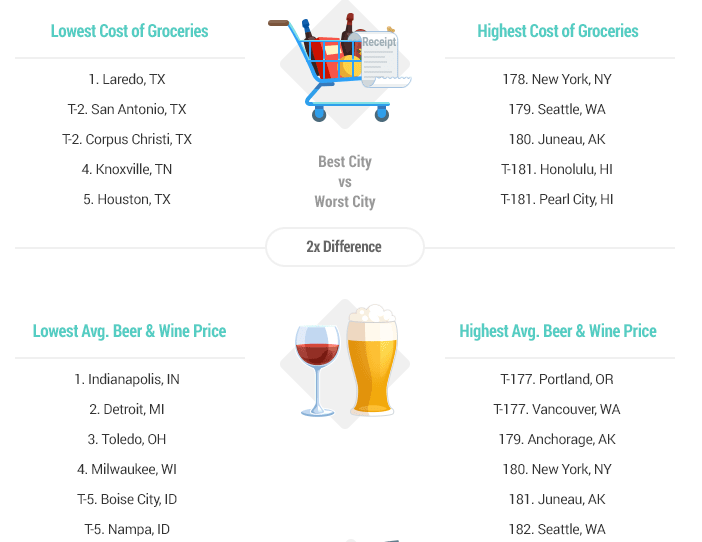
Cost of groceries, average alcohol prices, restaurants per capita, and coffee shops per capita are among additional factors that were taken into consideration.
Texas has 4 of the top 5 cities—Laredo, San Antonio, Corpus Christi, and Houston—for the lowest priced groceries. The other city is Knoxville, TN. For the highest-priced groceries, the cities from the list consist of New York, NY, Seattle, WA, Juneau, AK, Honolulu, HI, and Pearl City, HI.
Alcohol is cheapest in Indianapolis, IN, Detroit, MI, Toledo, OH, Milwaukee, WI, Boise City, ID, and Nampa, ID. It’s most expensive in Portland, OR, Vancouver, WA, Anchorage, AK, New York, NY, Juneau, AK, and Seattle, WA.
What’s striking here is that while Portland is number one on the list, alcohol is the most expensive in the city. Portland also has the highest number of breweries per capita which is something WalletHub also took into consideration.
Featured photo by Chan Walrus on Pexels
Map photo and best groceries photos are screenshots by RPS Relocation

Oct
Allergies—a health condition whereby the immune system is negatively impacted by foreign particles or substances—are a public nuisance. These substances can be found in cities across the nation; however, some places have a significantly higher amount than others.
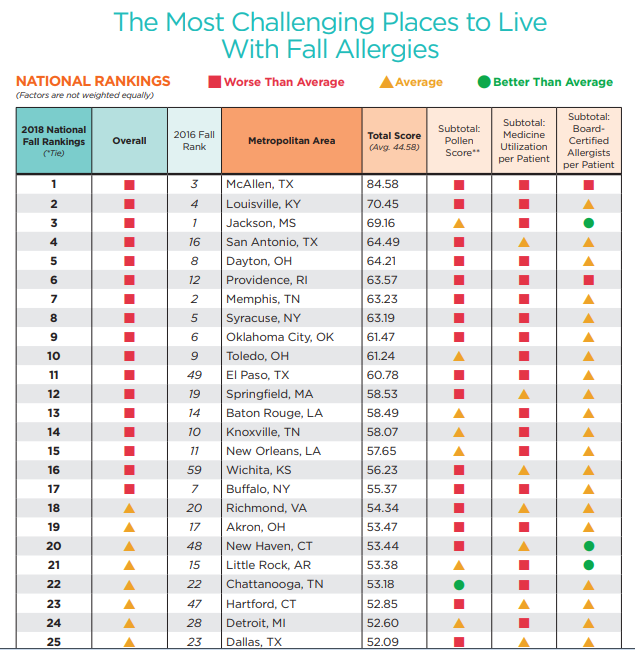
The Asthma and Allergy Foundation of America (AAFA) conducted a comprehensive study to identify where allergies are the worst during the Fall season. The actually listed 100 cities, which you’ll see at the end of this article.
AAFA’s Criteria for Inclusion
How did the AAFA determine which cities made the cut, and which didn’t? They describe it in detail: “The ranking is based on analysis of data from the 100 most-populated Metropolitan Statistical Areas (MSAs) in the contiguous 48 states. The three (3) individual factors analyzed for the 2018 rankings are: seasonal (Fall) pollen score, medication use (allergy) and number of allergy specialists. For each factor, AAFA used the most recently available calendar year data. Weights are applied to each factor; factors are not weighted equally. Total scores are calculated as a composite of all three factors.”
Tips for Allergy Prevention
The AAFA provides actionable tips which will help you avoid or reduce your allergies. The recommend wearing sunglasses outdoors, removing shoes in the home, and keeping windows closed. If you have carpeting, regular vacuuming will reduce allergens in your home. Bed sheets should also be cleaned on a regular basis.
The AAFA also recommends “CERTIFIED asthma & allergy friendly” products such as cleaning supplies. You can also find allergy-friendly bed mattresses and HVAC filters. The more allergy friendly products you own, the better chance you have at mitigating the presence of allergies in your home.
The Top 100 Cities with Fall Allergies
The cities below are ranked from worst to best as the “most challenging places to live with fall allergies”.
- McAllen, TX
- Louisville, KY
- Jackson, MS
- San Antonio, TX
- Dayton, OH
- Providence, RI
- Memphis, TN
- Syracuse, NY
- Oklahoma City, OK
- Toledo, OH
- El Paso, TX
- Springfield, MA
- Baton Rouge, LA
- Knoxville, TN
- New Orleans, LA
- Wichita, KS
- Buffalo, NY
- Richmond, VA
- Akron, OH
- New Haven, CT
- Little Rock, AR
- Chattanooga, TN
- Hartford, CT
- Detroit, MI
- Dallas, TX
- Birmingham, AL
- Philadelphia, PA
- Columbia, SC
- Columbus, OH
- Tulsa, OK
- Greenville, SC
- Albany, NY
- Grand Rapids, MI
- 21 Cleveland, OH
- Pittsburgh, PA
- Charleston, SC
- New York, NY
- Scranton, PA
- Miami, FL
- St. Louis, MO
- Bridgeport, CT
- Austin, TX
- Allentown, PA
- Las Vegas, NV
- Omaha, NE
- Greensboro, NC
- Winston-Salem, NC
- Augusta, GA
- Virginia Beach, VA
- Cape Coral, FL
- Houston, TX
- Jacksonville, FL
- Fresno, CA
- Tucson, AZ
- Madison, WI
- Cincinnati, OH
- Nashville, TN
- Chicago, IL
- Rochester, NY
- Riverside, CA
- Charlotte, NC
- Indianapolis, IN
- Orlando, FL
- Des Moines, IA
- Los Angeles, CA
- Modesto, CA
- Lakeland, FL
- Minneapolis, MN
- Harrisburg, PA
- Kansas City, MO
- Albuquerque, NM
- Tampa, FL
- Durham, NC
- Worcester, MA
- Oxnard, CA
- Atlanta, GA
- Milwaukee, WI
- Baltimore, MD
- Bakersfield, CA
- Phoenix, AZ
- Boston, MA
- Palm Bay, FL
- Washington, DC
- San Diego, CA
- Spokane, WA
- Stockton, CA
- Daytona Beach, FL
- Sarasota, FL
- Raleigh, NC
- Sacramento, CA
- Salt Lake City, UT
- San Francisco, CA
- Ogden, UT
- Colorado Springs, CO
- Seattle, WA
- San Jose, CA
- Boise, ID
- Portland, OR
- Provo, UT
- Denver, CO
Featured image by Public Domain Pictures on Pexels
AAFA city allergies chart photo is a screenshot by RPS Relocation

Oct
The Top 20 Cities to Move to For Startup Founders
Jason C. 0 comments Data Visualization, Moving News
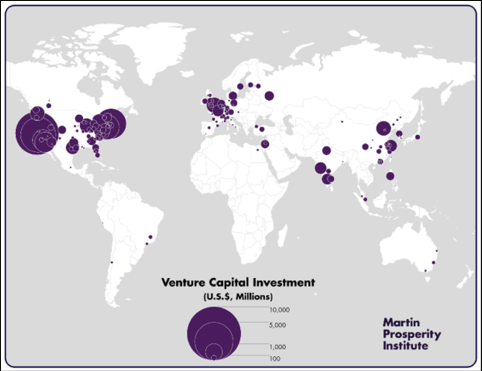
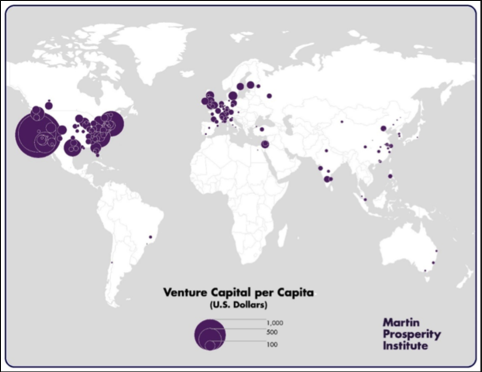
Follow the money! Venture capital investment isn’t equally dispersed; instead, large amounts of it go to a limited number of countries around the world. If you have any interest in working at an emerging firm, you’d do well to move to an area where these firms are plentiful.
Richard Florida of Business Insider reported on the flow of venture capital around the world. Specifically, he created a list of the top twenty metropolitan cities that see the most amount (in dollars) of venture capital. They are:
San Francisco
San Jose
Boston
New York
Los Angeles
San Diego
London
Washington
Beijing
Seattle
Chicago
Toronto
Austin
Shanghai
Mumbai
Paris
Bangalore
Philadelphia
Phoenix
Moscow
America in the Lead
As you can see from the map, America has the highest concentration of major venture capital investment. Richard Florida writes “the U.S. is the world’s dominant center for venture capital, accounting for nearly 70 percent (68.6 percent) of total global venture capital, followed by Asia and Europe with roughly 14 percent each (14.4 percent for Asia and 13.5 percent for Europe).”
Given our wealth as a nation, it’s not much of a surprise there are so many American cities on the list. Perhaps the most interesting is that there are two cities in India that are on the list: Bangalore and Mumbai.
Looking at the map shows there isn’t much venture capital investment in Latin America, comparatively. That also goes for Canada, Eastern Europe Africa, Southeast Asia, and Australia.
Taking City Size into Consideration
There’s another way to look at the flow of venture capital. Instead of viewing the total invested in a certain area, you can look at investments on a per capita basis. The updated top twenty list is shown below:
San Jose
San Francisco
Boston
Durham
San Diego
Austin
Seattle
Washington
Jacksonville
Los Angeles
New York
Toronto
Salt Lake City
Madison
Greensboro
New Haven
Denver
Oxnard, CA
Providence, RI
Phoenix
The cities are mixed up and you see some newcomers like Phoenix, Oxnard, and Providence. As a matter of fact, most of the newcomers are more American cities. Most foreign countries have dropped out of this top twenty list entirely. As a matter of fact, only one foreign city remains on this new list: Toronto. And Toronto is close enough in proximity to New York to be considered “foreign” if we think in terms of a place as far as Beijing or Mumbai.
Richard Florida writes “Outside of the U.S., Toronto is the only metro to make the top twenty. London, which ranked 7th on overall venture investment, drops down to 39th. Beijing, which ranked ninth in overall venture investment, now drops to 55th. And Mumbai, ranked 15th overall, drops to 70th when accounting for population. Other notable metros that fall out of the top 20 are Paris (53rd), Bangalore (43rd), and Shanghai (74th).”
Looking at the map, it doesn’t appear much has changed. The “heat map” shows a greater intensity on the American west coast and a smaller intensity on the eastern coast. However, there’s one major similarity between both maps: Venture capital is flourishing in America.
Featured image by rawpixel.com on Pexels
Venture capital map photos are screenshots by RPS Relocation

Sep
One of the reasons people relocate is to chase an opportunity. Another reason is for them is to enjoy a heightened quality of life. The better quality of life may include lower crime, increased affordability, or a larger number of amenities offered by the city or local organization. MONEY, a division of Time Magazine, put together a list of the 50 greatest places to live in America. Here are their top ten picks:
- Frisco, Texas
- Ashburn, Virginia
- Carmel, Indiana
- Ellicott City, Maryland
- Cary, North Carolina
- Franklin, Tennessee
- Dublin, California
- Highlands Ranch, Colorado
- Sammamish, Washington
- Woodbury, Minnesota
Criteria to Make the List
The list—which features cities from all over the country—is governed by nine categories. They are:
- Economy
- Cost of Living
- Diversity
- Education
- Income
- Housing
- Crime
- Amenities
- Ease of Living
Having this many categories allowed MONEY to conduct a comprehensive analysis in support of their findings. In addition, they write “we looked only at places with populations of 50,000 or greater. We eliminated any place that had more than double the national crime risk, less than 85% of its state’s median household income, or a lack of ethnic diversity. This gave us 583 places.” Narrowing the criteria by these small factors meant that only 8.5% of cities would be chosen.
With regards to home prices, MONEY needed to find a partner with access to a database of nation-wide prices. So they teamed up with Realtor.com. Realtor.com—an online real estate broker—was the perfect answer to MONEY’s problem. The real estate broker was able to grant access to home prices in virtually every city across the country.
There are two places I’d like to focus on due to their close proximity to the cities we serve. Frisco, TX is near Dallas and Sammamish, WA is near Seattle. Let’s start with Frisco.
The Greatest Place: Frisco, TX

There’s another bonus to talking about Frisco, TX: It ranks number one on the list! Frisco excels in every category of criteria. MONEY writes Frisco is “a sleepy bedroom community of 6,500 people as recently as 1990, the city today houses around 180,000 residents. Jobs are projected to grow by nearly 15% over the next four years, according to Moody’s Analytics, and companies from T-Mobile to Oracle have offices in the city.” Here’s what this means: People are flocking to Frisco and there’s no indication its popularity will wane anytime soon.
Frisco is also a great place for growing families. Indeed, public schools in the city have “the highest graduation rate of all the cities and towns MONEY evaluated this year.”
A Tech and Outdoors Haven: Sammamish, WA

Sammamish also ranks very highly on the list, coming in at number nine. When people think about tech companies, they think “Silicon Valley” which is located in California; however, Sammamish “attracts many of the people who work for Microsoft, Amazon, Expedia and other tech giants.” Like Silicon Valley, the home prices are relatively expensive. But here’s the good news: salaries are relatively high as well.
Culture and recreational living flourish in Sammamish. The city has fourteen parks and nature preserves which are populated by diverse wildlife. Sammamish is also home to regular concerts and exhibitions.
Take a look at other places on the list. If you’re interested in relocation anywhere, make sure you use our form to get a free moving quote.
Featured image by Pixabay on Pexels
Farmers market and bike lane photos are screenshots by RPS Relocation

Sep
“The world is getting smaller” has become popular phrase due to globalization. But here’s the truth: the square footage of the world isn’t changing; however, new homes are getting bigger, at least in America.
The American Enterprise Institute recently shared some surprising information about changes in home size, square footage costs, and living space per person.
Average New Home Size
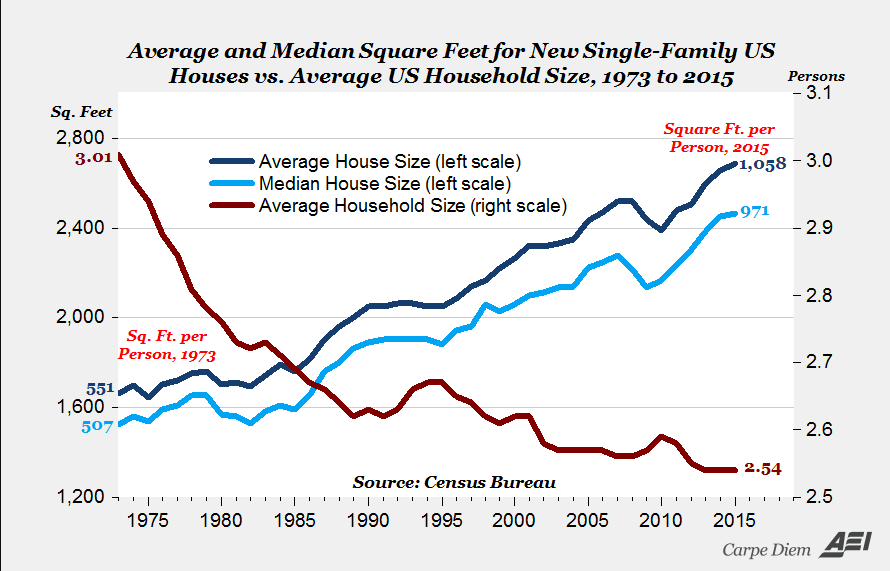
Mark J. Perry—economics professor and author of the article—writes “the median-size house has increased in size by almost 1,000 square feet, from 1,525 square feet in 1973 to 2,467 last year. In percentage terms, both the average and median size of new US houses have increased by 62% since 1973.”
Here’s what that means: if the trend were to continue, the square footage of new homes will have more than doubled within a 100-year time period! What happened to the “people today are making less than their parents did” debate? While there’s truth to that side, that fact that new homes are increasing so much in size makes it seem people today have more money.
The chart below shows the climb in square footage of new homes in 1973. Notice the dip from around 2008 until 2011. The short decline in total square footage for new homes during those years is likely to what’s now known as the Great Recession of 2008.
Cost per Square Foot
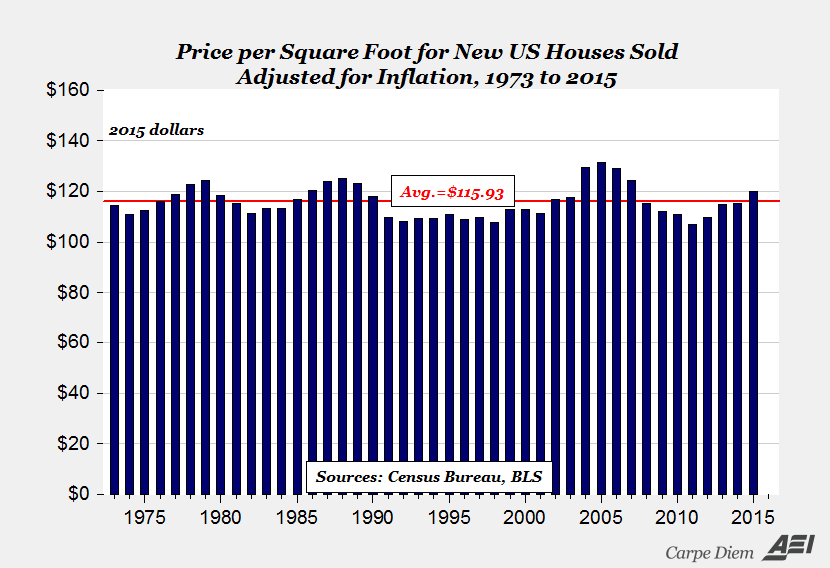
With the square footage in homes doubling since 1973, one would presume the cost per square footage is now less expensive. But that’s not the case. As a matter of fact, the price per square feet has relatively stayed the same, even considering inflation. At least the price hasn’t gone up!
Mr. Perry writes that the prices “range between about $107 and $128 per square foot at an average of about $116. The price of just more than $120 per square foot for new houses sold in 2015 was 8.5% below the peak of $131.29 (in 2015 dollars) per square foot for a new house in 2005.”
The graph below visualizes the price per square footage since 1973.
Living Space per Person
Is the average new home getting larger because more people are living under the same roof? The answer is no. As a matter of fact, people today have more square footage than they did in 1973.
Mr. Perry breaks down exactly how much more square footage each person has now, on average. He writes the “square footage of living space per person in a new US house has increased from 507 to 971 square feet using the median size house, and from 551 to 1,058 square feet using the average size house. In percentage terms, that’s a 92% increase for both the median or average house size per person.”
Final Thoughts on Living Space
Mr. Perry finishes his article on a lighter note. He explains that focusing on stagnating wages and decreasing household incomes do not paint the entire picture of our economy. Instead, he points to our overall quality of life improving since the 1970s, which is made apparent in the additional square footage we have and the price remaining about the same.
Featured photo by Sarah Jane on Pexels
American Enterprise Institute graph photos are screenshots by RPS Relocation

Jul
Immigration to the U.S.—legal and illegal—is currently a hot topic in our political sphere. Both types of immigration happen on a daily basis. Another type of movement, domestic migration, also happens on a daily basis. As we’ll find out, the movement isn’t equal. Some states are gaining domestic migrants and other states are losing domestic migrants. We’re going to focus on the states that are losing migrants.
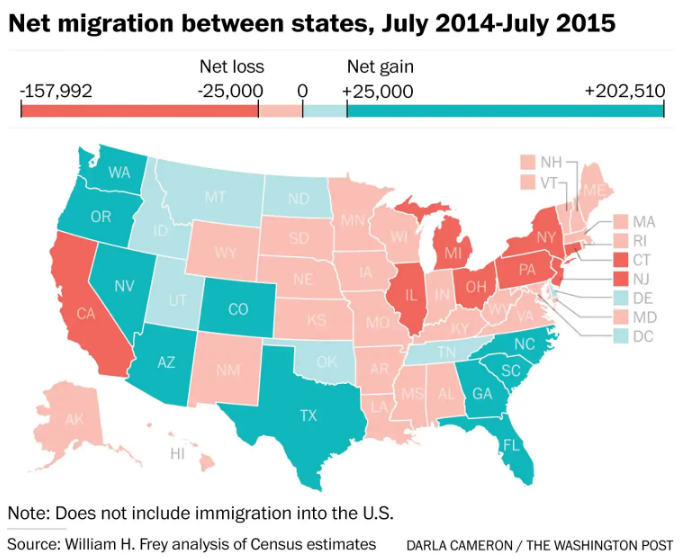
These are the states people don’t want to move to in 2018. In the chart below you’ll see some states shaded red which means the have a negative net migration, and some states shaded blue which means they have a positive net migration from current U.S. residents or citizens.
The Washington Post has detailed which states these are. They pulled the data from the best source: the U.S. Census Bureau. The data does not consider international immigration; however, the information is interesting nevertheless. Currently it would appear that U.S. residents are moving away from California, New York, Illinois, New Jersey, Michigan, Ohio, Pennsylvania, and Connecticut.
Let’s take a closer look at the top three states people seem to be fleeing from: California, New York, and Illinois.
California
California is surrounded by Oregon, Nevada, and Arizona. As you see in the picture, California is red and the other states are blue. It seems as if migrants from California are jumping the state line in support of one of the neighboring states or moving elsewhere across the country. In an earlier post we showed how Californians were moving to places nearby like Nevada and and to states further away like Texas, New York, and Georgia.
New York
New York, a state in the northwest, is surrounded by other states people are migrating from. If we only take into consideration domestic data, it would seem like the population as a whole is getting smaller in New York. Taking international immigration into account gives a better picture, however. “For states like New York, domestic migration losses are offset by new immigration from abroad.”
Illinois
Like New York, Illinois is also surrounded by states U.S. residents are migrating away from; however, neighboring states have less of an outflow than that of the state of Illinois. “Illinois, meanwhile, had a net loss of about 105,000 residents, its largest one-year population leak in the 21st century.”
Similarities of California, New York, and Illinois
Why are people leaving these states? Or, perhaps the better question is this: why aren’t people moving to these states? The answer could be in the cost of living.
According to USA Today, California and New York both make an appearance on the list of seven most expensive states to live in. They write the “median home value in the sunny state is $429,000, and homes generally list for a median price of $425,000 ($256 per square foot).” New York is even more expensive. They continue “New York is known for its higher cost of living, with median home prices sitting at around $525,000 ($507 per square foot). The real estate market in the Big Apple is hot, as statewide housing values have risen 8.5% over the past year, according to Zillow.”
Illinois didn’t make that list; however, which could be because most of the state is farmland. Most of the population in Illinois lives in urban and surrounding suburban areas. Chicago is the largest city in the state. According to Inc., Chicago is listed as one of the ten least affordable cities in America. They write “The cost to live comfortably here is $68,670 [per year] more than $15,000 a year less than New York or LA”. This should come as no surprise as to why people are leaving the city of Chicago of lower cost living in other parts of the country, therefore giving the State of Illinois a negative net migration.
Both Los Angeles and Chicago, the biggest cities in California and Illinois, also share a dubious distinction in that the Washington Post recently added both to a different list, a list of cities were murders are most likely to go unsolved. Los Angeles has been improving but the report said there are still large pockets were murders go unsolved like Pico-Union. Chicago was named as one of the top 2 cities where murders would go unsolved according to the report. There’s no way of knowing how much this impacts net domestic migration figures for two of the largest cities in America or how much unsolved murders in these big cities impacts an entire state’s net domestic migration.
Featured photo and Chicago photo by Pixabay on Pexels
Jul
There are thousands of towns, counties, and cities in America; but not all of them will be considered the best. “Best”, as a term, is quite subjective. Different people will have unique opinions as to what they consider the best cities. Often times, their answers will be related to their own past experiences.
In order to get more objective results, certain criteria should be offered. In addition, the criteria should be judged by an authoritative source. Best Cities has stepped up to the plate in this regard. Let’s take a look at their criteria and then see what cities they view as the best in the nation.
Criteria for the Best Cities
Best Cities has described the categories used in their methodology. “The ranking evaluates each qualifying city across the six pillars of place equity: Place, Product, Programming, People, Prosperity, and Promotion.” Having so many categories allows for better final results.
Place refers to the quality (crime, air quality, etc) of the city. Product refers to the city’s institutions, attractions. and infrastructure. Programming refers to the city’s arts, culture, entertainment. and culinary scene. People refers to the immigration rate and diversity of a city. Prosperity refers to the city’s employment and unemployment rate. And Promotion refers to the number of stories, references and recommendations shared online about a city.
Best Large Cities
Best Cities lists 50 of their favorite large cities based on their criteria. Large cities are those that have “metro populations of a million people or more.” For brevity, we’ll list the top 10. They are:
1. New York
2. Chicago
3. Los Angeles
4. San Francisco
5. Las Vegas
6. San Diego
7. Houston
8. Miami
9. Seattle
10. Boston
These cities are among the most recognizable in the country. New York, Chicago, Los Angeles, Miami—these cities are icons of American metropolitan areas. Chicago scored a perfect score when it comes to New York has a perfect score in the Place, Programming, Prosperity, and Promotion categories. Furthermore, New York has a near perfect score in the Product category. It’s no surprise then why it came in at first place on the list. Although Washington, DC is the capital, New York City is revered as the “Empire State” due to its wealth and resources.

Best Small Cities
Best Cities also lists 50 of their favorite small cities. Small cities are those that have “metro populations under a million people.” Again, we’ll list the top 10 in this category. They are:
1. Honolulu
2. Omaha
3. Albuquerque
4. Charleston
5. El Paso
6. Reno
7. Tulsa
8. Madison
9. Myrtle Beach
10. Asheville
The cities that are on this list are much less recognizable. Asheville, El Paso, Madison—these cities are relatively unknown to many people in America. Some of them, like Asheville, score highest with the Product criteria. Asheville is known for its universities, festivals, and other year-round events. In another example, Honolulu has a perfect score in the Place, Programming, and Promotion categories. It’s no surprise that Honolulu has a perfect score with Place, seeing as how the city has some of the most beautiful beaches and landscapes in the world.
New York City Photo by Lukas Kloeppel and Honolulu Photo by Tyler Lastovich on Pexels

Jul
Californians are leaving! Well, not all of them are; however, there are a few reasons native Californians are looking to live elsewhere. KERA News, an organization based in Texas, dug a little deeper as to why some Californians are relocating. Their article details why some are moving to parts of Texas and other places.
Home prices in many areas of California are expensive. “It’s clear from the median home prices why Californians are moving to North Texas. Homes on the market in the four coastal California cities averaged $720,000 in March 2017, compared to $313,000 in Dallas.” The average home prices in those four cities are double the average home price in Dallas! It’s no surprise, then, why some people in California are moving.
Top Ten Cities for Emigration
Where else are Californians moving to? KERA News listed additional cities, which they pulled from a Trulia article. The cities, as you’ll soon read, are literally scattered all over the United States. The top ten cities Californians are moving to, in order, are:
- Las Vegas, Nevada
- New York, New York
- Phoenix, Arizona
- Dallas, Texas
- Seattle, Washington
- Portland, Oregon
- Atlanta, Georgia
- Houston, Texas
- Chicago, Illinois
- Denver, Colorado
Do you see any cities on the list that are surprising? Three of them, New York, Seattle, and Chicago, stand out. This is because these three cities aren’t known for affordable housing as much as a city like Dallas. New York City has some of the most expensive homes in the country.
KERA News continues, “Dallas and Fort Worth had among the largest population gains last year. On the list of 15 cities nationwide with the most population growth, Dallas’ increase of 18,935 people put it at No. 3, and Fort Worth was No. 4, with an increase of 18,664.” Again, the focus is on cities in Texas due to their job opportunities and lower cost of living.
It’s important to highlight Seattle, Dallas, and Houston specifically. According to Curbed, more homes are coming to the market in what has been a slim housing market as of late. “In the Seattle city limits in June 2018, NWMLS saw 1,246 active listings, a 75.5 percent increase from the year before.” Dallas and Houston are also highlighted because their real estate market is getting hotter as well.

The New Tax Law
The Tax Cuts and Jobs Act of 2017 contained more than tax cuts. It also closed some tax loopholes and established some deduction ceilings. The tax law became effective January 1, 2018. Therefore, many people don’t really know how it will affect them yet. They’ll find out next April when they submit their taxes.
Here’s what I’m getting to: there is a maximum deduction for state and property taxes. The magic number is $10,000. Let’s say a homeowner in California paid $15,000 in property taxes each year. Now, with the new tax law, they will not be able to deduct that extra $5,000 from their taxes. It makes financial sense for people with expensive homes and high property taxes to move to an area with lower home prices and property taxes.

Featured Photo by Bella Co and Dallas Photo by Pixabay on Pexels
Congress Photo by Wikimedia Commons on Wikipedia
Most Recent Blog Posts
 A Dallas Area Home Buyer Had to Pay $300,000 More Than Asking Price For Their New Home22 May, 2021
- Canada's Home Prices Have Risen 168.4% Since 2000, USA Home Prices Have Risen 54.99%01 Apr, 2021
- Home Prices in Seattle Are Skyrocketing12 Mar, 2021
- Seattle Among Best Cities for Startups08 Jul, 2019
- Renters in Chicago and New York are fleeing south for Dallas24 Jun, 2019