Blog
Sep
“The world is getting smaller” has become popular phrase due to globalization. But here’s the truth: the square footage of the world isn’t changing; however, new homes are getting bigger, at least in America.
The American Enterprise Institute recently shared some surprising information about changes in home size, square footage costs, and living space per person.
Average New Home Size
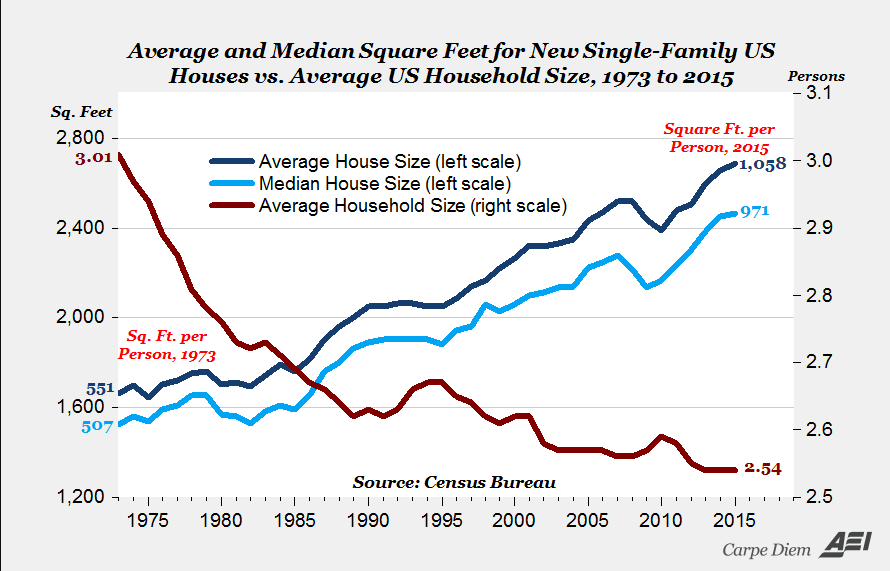
Mark J. Perry—economics professor and author of the article—writes “the median-size house has increased in size by almost 1,000 square feet, from 1,525 square feet in 1973 to 2,467 last year. In percentage terms, both the average and median size of new US houses have increased by 62% since 1973.”
Here’s what that means: if the trend were to continue, the square footage of new homes will have more than doubled within a 100-year time period! What happened to the “people today are making less than their parents did” debate? While there’s truth to that side, that fact that new homes are increasing so much in size makes it seem people today have more money.
The chart below shows the climb in square footage of new homes in 1973. Notice the dip from around 2008 until 2011. The short decline in total square footage for new homes during those years is likely to what’s now known as the Great Recession of 2008.
Cost per Square Foot
With the square footage in homes doubling since 1973, one would presume the cost per square footage is now less expensive. But that’s not the case. As a matter of fact, the price per square feet has relatively stayed the same, even considering inflation. At least the price hasn’t gone up!
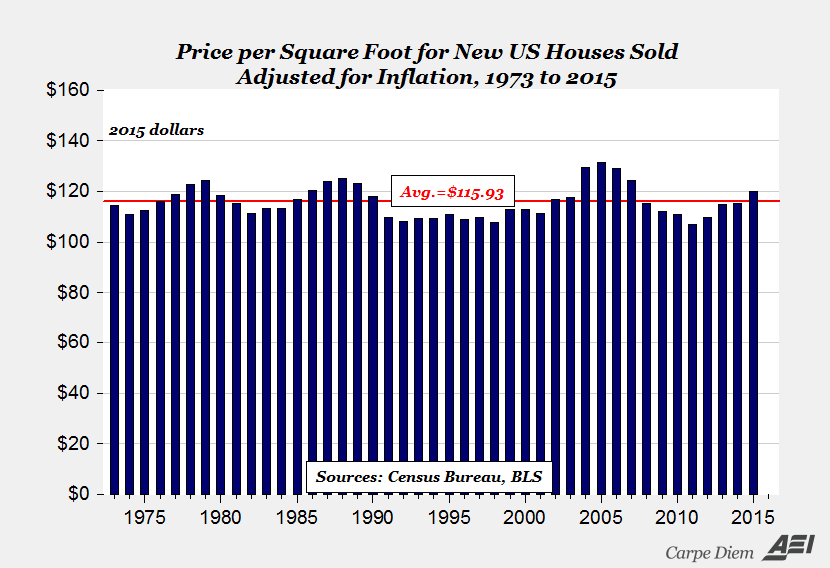
Mr. Perry writes that the prices “range between about $107 and $128 per square foot at an average of about $116. The price of just more than $120 per square foot for new houses sold in 2015 was 8.5% below the peak of $131.29 (in 2015 dollars) per square foot for a new house in 2005.”
The graph below visualizes the price per square footage since 1973.
Living Space per Person
Is the average new home getting larger because more people are living under the same roof? The answer is no. As a matter of fact, people today have more square footage than they did in 1973.
Mr. Perry breaks down exactly how much more square footage each person has now, on average. He writes the “square footage of living space per person in a new US house has increased from 507 to 971 square feet using the median size house, and from 551 to 1,058 square feet using the average size house. In percentage terms, that’s a 92% increase for both the median or average house size per person.”
Final Thoughts on Living Space
Mr. Perry finishes his article on a lighter note. He explains that focusing on stagnating wages and decreasing household incomes do not paint the entire picture of our economy. Instead, he points to our overall quality of life improving since the 1970s, which is made apparent in the additional square footage we have and the price remaining about the same.
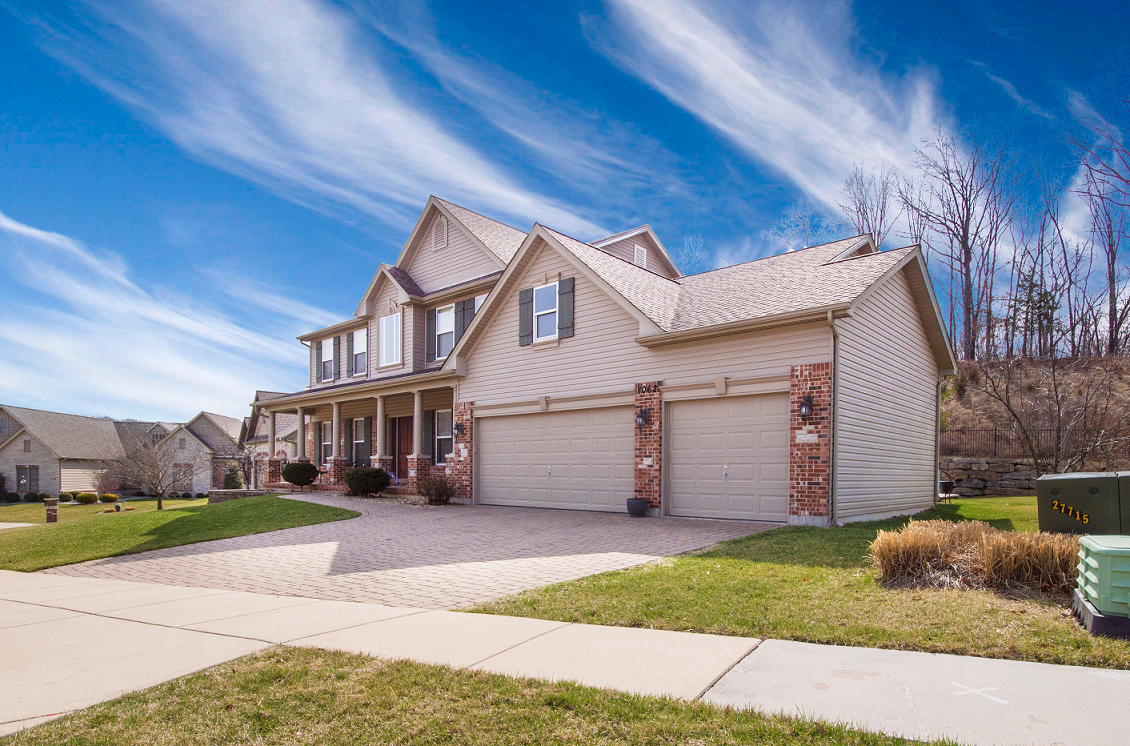
Featured photo by Sarah Jane on Pexels
American Enterprise Institute graph photos are screenshots by RPS Relocation
Comments
Most Recent Blog Posts
 A Dallas Area Home Buyer Had to Pay $300,000 More Than Asking Price For Their New Home22 May, 2021
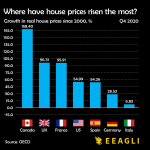
- Canada's Home Prices Have Risen 168.4% Since 2000, USA Home Prices Have Risen 54.99%01 Apr, 2021
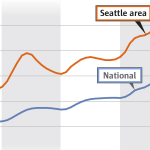
- Home Prices in Seattle Are Skyrocketing12 Mar, 2021
- Seattle Among Best Cities for Startups08 Jul, 2019
- Renters in Chicago and New York are fleeing south for Dallas24 Jun, 2019