Blog

Nov
The Green Energy Map of Canada
Jason C. 0 comments Maps
How green is Canada’s energy? When it comes to energy, let’s just say it depends on the province. Like the individual states in the United States, the provinces in Canada are diverse next to each other. Reddit user PaulsEggo posted an image visualizing how green each province is.
The Province Map
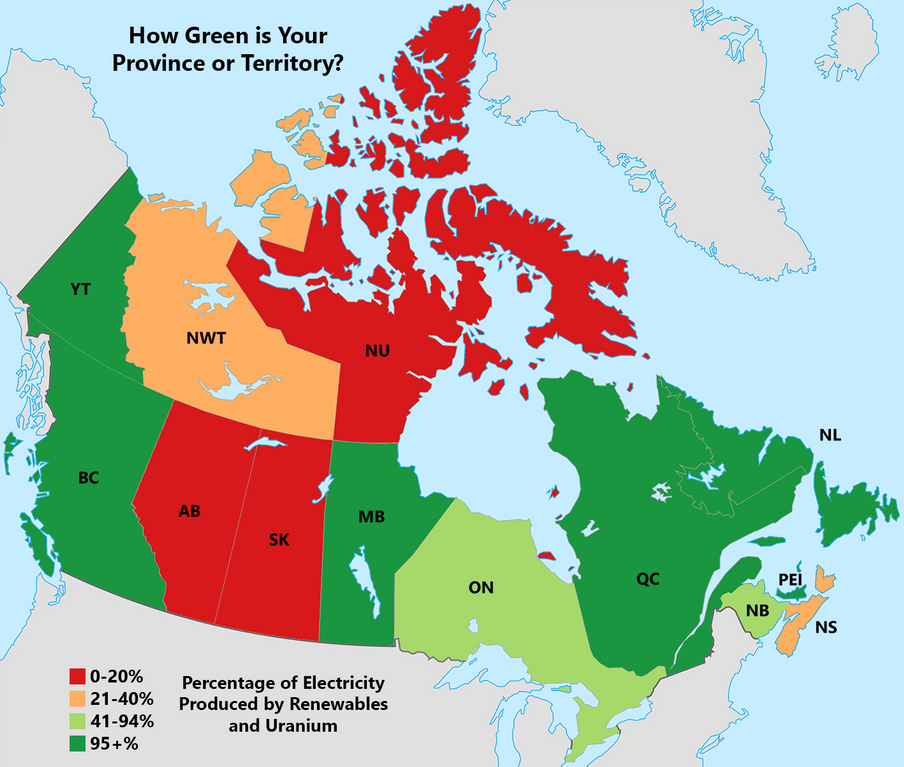
The provinces vary in color from red to light orange to light green to green. The red provinces are those which have a low percentage of electricity produced by renewables and uranium. The green, on the other side of the spectrum, are provinces which have a high percentage of electricity produced by renewables and uranium. Here are exact percentages for each color:
- Red: 0-20%
- Light Orange: 21-40%
- Light Green: 41-94%
- Green: 95+%
Territorial Statistics Chart
Reddit user PaulsEggo created the map visualization; in addition, he created the following provincial and territorial statistics chart.
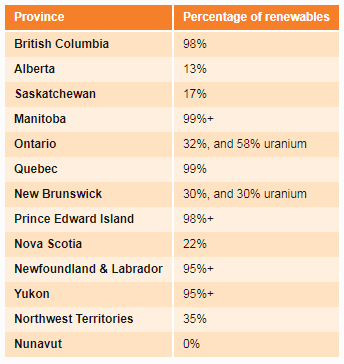
It’s important to note that uranium and nuclear energy are considered clean energy. The chart is based on the data PaulsEggo collected from the National Energy Board (NEB). NEB writes, “Canada is rich in energy supply. From the hydroelectric reservoirs of British Columbia, Manitoba, Ontario, and Quebec to the hydrocarbon resources of western Canada and offshore East Coast. From the uranium deposits in northern Saskatchewan to the abundant wind and solar potential across the country. This wealth of resources ranks Canada as the fifth largest natural gas producer, sixth largest crude oil producer, second largest hydro producer and sixth for share of renewable electricity generation.”
Alberta, Saskatchewan, and Geography
Alberta and Saskatchewan are among the provinces colored in red in the map. One Reddit user, Tamer_, commented “They’re still burning 87% of the coal and 72% of the natural gas used for power in Canada”.

Another Reddit user, kylethsmith, commented how geography plays a role in having clean energy. They write, “The map is purely a result of geography. The vast majority of the green energy reflected in this map is hydro power, which is abundant in places like BC and Quebec. Ontario has some great hydro electric assets, too, along with the population density to make building a large nuclear plant viable. Saskatchewan is flat. There aren’t a lot of waterfalls on the prairies to use for hydroelectricity. It is also sparsely populated, making the investment of tens of billions of dollars in a nuclear plant uneconomical”.
Featured photo by Daniel Joseph Petty on Pexels
Canada visualization map, statistics chart, and Reddit comments are screenshots by RPS Relocation
Comments
Most Recent Blog Posts
 A Dallas Area Home Buyer Had to Pay $300,000 More Than Asking Price For Their New Home22 May, 2021
- Canada's Home Prices Have Risen 168.4% Since 2000, USA Home Prices Have Risen 54.99%01 Apr, 2021
- Home Prices in Seattle Are Skyrocketing12 Mar, 2021
- Seattle Among Best Cities for Startups08 Jul, 2019
- Renters in Chicago and New York are fleeing south for Dallas24 Jun, 2019