Blog
Jun
Question: Who still has a landline phone? Short answer: a lot of people. Sure, the tide is turning against landlines in favor of cell phones. This has been happening ever since cell phones started to become popular. Now, and thanks to Overflow Data, we have the numbers of which states have the most wireless only households. Let’s check out their findings.
Map of the States
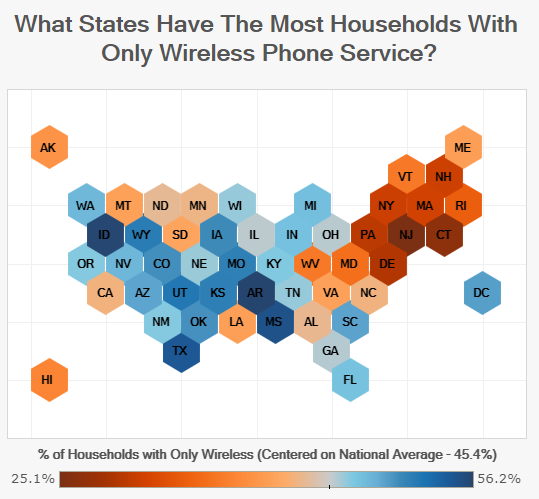
The visualization above is essentially a map of the United States. It doesn’t show the shape of the states; instead, the states are represented by colors on a moving scale from red to blue.
The red states are the ones with less wireless only households. There is no landline “telephone” within more of those homes in the blue states.
According to Chase from Overflow Data, “An increasing number of households are making the switch to only having wireless home service. The CDC tracks this in the National Health Interview Survey and estimated that at the end of 2014, 45.4% of households only have Wireless phone service.”
A few things can be surmised by looking at the map visualization. One is that the states with fewer landlines in the middle of the country. The states on the east coast have more cell phones. States like South Dakota, Louisiana, and West Virginia are the outliers. These three states lean towards having more households with landlines.
Percentages of only Wireless Service
In this section, we’re going to talk about the states in order of wireless phone service. More specifically, we’re going to list them from most wireless only to least wireless only. We’ll also include the standard error percentage that was found during the study. Let’s get started!
- Arkansas – 56.2%; SE – 2.2%
- Idaho -56.1%; SE – 2.0%
- Mississippi – 55.1%; SE – 2.2%
- Texas – 54.6%; SE – 1.1%
- Utah – 52.2%; SE – 2.0%
- Wyoming – 51.8%; SE – 1.3%
- Kansas – 51.6%; SE – 1.9%
- Missouri – 51.5%; SE – 2.1%
- Iowa – 50.7%; SE – 1.7%
- Colorado – 50.5%; SE – 1.9%
- Oklahoma – 50.4%; SE – 1.9%
- District of Columbia – 49.7%; SE – 2.2%
- South Carolina – 49.5%; SE – 2.1%
- Arizona – 49.4%; SE – 2.1%
- Nevada – 48.4%; SE – 2.0%
- Washington – 48.3%; SE – 1.9%
- Michigan – 47.8%; SE – 1.7%
- Indiana – 47.7%; SE – 2.0%
- Florida – 47.6%; SE – 1.3%
- Kentucky – 47.1%; SE – 2.0%
- New Mexico – 47.0%; SE – 2.3%
- Oregon – 47.0%; SE – 1.9%
- Tennessee – 46.6%; SE – 1.9%
- Wisconsin – 46.6%; SE – 1.9%
- Nebraska – 46.5%; SE – 1.9%
- Georgia – 45.9%; SE – 1.7%
- Ohio – 45.8%; SE – 1.6%
- Illinois – 45.7%; SE – 1.5%
- North Dakota – 43.6%; SE – 1.9%
- Alabama – 43.4%; SE – 2.3%
- Minnesota – 43.1%; SE – 1.9%
- North Carolina – 42.9%; SE – 1.7%
- California – 42.8%; SE – 0.9%
- South Dakota – 41.4%; SE – 2.0%
- Virginia – 41.1%; SE – 1.9%
- Montana – 41.0%; SE – 2.4%
- Louisiana – 40.9%; SE – 2.2%
- Maine – 40.8%; SE – 2.2%
- Alaska – 39.7%; SE – 2.2%
- Hawaii – 38.3%; SE – 1.8%
- Vermont – 37.2%; SE – 1.9%
- West Virginia – 37.2%; SE – 2.2%
- Maryland – 36.2%; SE – 1.9%
- Rhode Island – 34.6%; SE – 2.0%
- Massachusetts – 31.5%; SE – 1.8%
- New Hampshire – 31.2%; SE – 1.5%
- New York – 31.1%; SE – 1.1%
- Pennsylvania – 30.0%; SE – 1.4%
- Delaware – 29.4%; SE – 1.9%
- Connecticut – 26.7%; SE – 1.7%
- New Jersey – 25.1%; SE – 1.5%
Here are the top 5 states with households having more wireless only phone service: Arkansas, Idaho, Mississippi, Texas, and Utah. And here are the 5 states with households having less wireless service: New Jersey, Connecticut, Delaware, Pennsylvania, New York, and New Hampshire.
Landline and Wireless Phone Facts
According to Statista, 2015 was the year which half of all households had a landline and half had a cell phone only. This may come as a surprise to many people because 2015 was only a few years ago. Cell phones have taken over as the more popular choice. Landlines will likely never recover.
Do you know of anyone with a landline telephone? It’s a question still asked on my official forms that you would fill out at places like a doctors office. Landline
Felix Richter of Statista writes, “In 2004, more than 90 percent of households in the U.S. had an operational landline phone – now it’s little more than 40 percent. That’s according to data provided by the Centers of Disease Control and Prevention, which has been tracking phone ownership in the U.S. as a by-product of its biannual National Health Interview Survey since 2004.”
The percentage of households with a landline was 41.7% in 2018. By the time you’re reading this, that number is like 40% or below. Within the next decade, if the trend keeps its pace, we imagine there will only be around 20% of households with a landline.
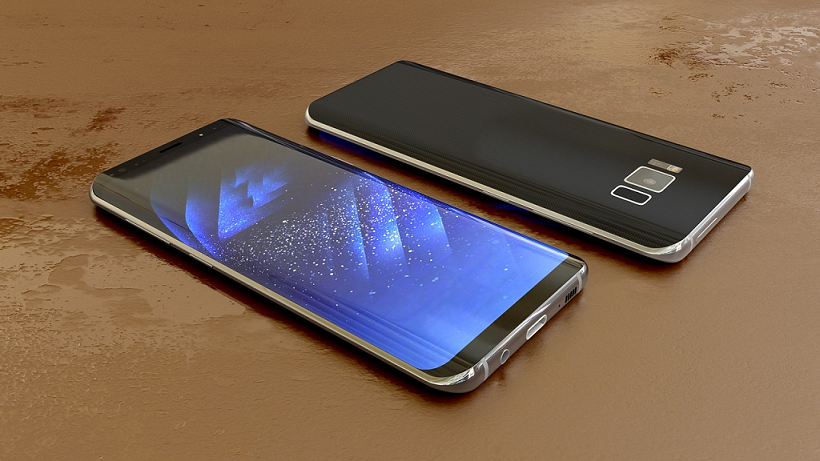
Featured photo by Monoar Rahman Rony on Pixabay
Comments
Most Recent Blog Posts
 A Dallas Area Home Buyer Had to Pay $300,000 More Than Asking Price For Their New Home22 May, 2021
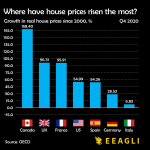
- Canada's Home Prices Have Risen 168.4% Since 2000, USA Home Prices Have Risen 54.99%01 Apr, 2021
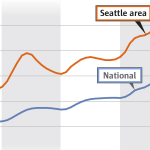
- Home Prices in Seattle Are Skyrocketing12 Mar, 2021
- Seattle Among Best Cities for Startups08 Jul, 2019
- Renters in Chicago and New York are fleeing south for Dallas24 Jun, 2019