Blog

May
Have you ever wondered which cities are up-and-coming and trending? New York, Chicago, Miami, and Los Angeles are the largest major cities in America; however, a couple of these cities—specifically, New York, and Chicago—have a net negative population migration. NerdWallet was able to compile the internal migration data for the entire country. Some of the data, such as with New York and Chicago, may surprise you.
In this article, we’re going to talk about where people are moving from and moving to. We’ll even get into average and owning costs within the cities these people are moving from and moving to. Finally, we’ll detail the methodology that NerdWallet used to put together their information.
Featured Data and Information
Let’s start with the big winners when it comes to population moves: Tampa and Phoenix. These two cities have gone from large to major cities, partly because of the massive influx of new residents. Elizabeth Renter of NerdWallet writes, “the Tampa, Florida, and Phoenix metro areas had the highest share of out-of-state newcomers who were homeowners (41%), compared with an average of 32% among all metros analyzed”.
Tampa has a yearly net migration of 48,905. 147,503 are newcomers to the city and 98,598 people move away, on average. Phoenix, on the other hand, has a yearly net migration of 88,942. 219,938 are newcomers to the city and 130,996 people move away, on average. Clearly, there’s more movement in and out of Phoenix but Tampa has plenty of action as well.
Renting and Owning
The total cost to rent or own is an important factor in choosing to move to a certain area. What’s even more important, however, is the percentage of income needed to rent or own.
Elizabeth Renter writes, “Homeowners with a mortgage spent 18-22% of their household income on ownership costs in most of the metros examined while renters spent 30-33%. In all of the metros analyzed, the median homeowner income was more than twice the median renter income.”
If this were the only data needed, it’s clearly a better decision to own rather than rent. After all, why would someone pay 30-33% of their income on housing when they would only have to pay 18-22%?
Let’s examine some major cities where owning and renting costs the least as a percentage of total income. We can start with the Charlotte Metropolitan Area. Here it costs an average of 18% to own and an average of 29% to rent as a percentage of income. What about the St. Louis area? Here, it costs an average of 18% to own and an average of 30% to rent as a percentage of income. The Minneapolis area is another major city where people are getting their bang for their buck. There, it costs an average of 19% to own and an average of 29% to rent as a percentage of income.
Methodology in Obtaining Data
NerdWallet was able to create a table and a map based on the data they used. The data actually comes from more than one source. Information from the Home Buyer survey, the American Community Survey, the American Housing Survey, and the U.S. Census Bureau was used.
Elizabeth Renter writes, “NerdWallet’s Home Buyer survey was conducted online within the U.S. among 2,029 U.S. adults ages 18 and older by The Harris Poll from Jan. 16-18, 2019. Migration data comes from the 2012-2016 American Community Survey five-year estimates and approximates the number of people who moved for any one-year period within that period. As defined by the U.S. Census Bureau, monthly housing costs for homeowners include all mortgage, home equity loan, real estate taxes, insurance, utility and fuel payments.”
NerdWallet, therefore, used four sources to put together their comprehensive housing and migration analysis.
Lastly, let’s take a look at NerdWallet’s interactive migration map. The following major cities are included:
- Atlanta
- Baltimore
- Boston
- Charlotte
- Chicago
- Dallas
- Denver
- Detroit
- Houston
- Los Angeles
- Miami
- Minneapolis
- New York City
- Orlando
- Philadelphia
- Phoenix
- Portland
- Riverside
- San Antonio
- San Diego
- San Francisco
- Seattle
- St. Louis
- Tampa
- Washington, D.C.
Featured photo by Gordon Johnson on Pixabay
U.S. Migration map is embedded from Nerd Wallet
Comments
Most Recent Blog Posts
 A Dallas Area Home Buyer Had to Pay $300,000 More Than Asking Price For Their New Home22 May, 2021
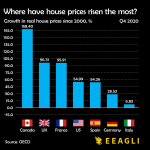
- Canada's Home Prices Have Risen 168.4% Since 2000, USA Home Prices Have Risen 54.99%01 Apr, 2021
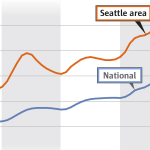
- Home Prices in Seattle Are Skyrocketing12 Mar, 2021
- Seattle Among Best Cities for Startups08 Jul, 2019
- Renters in Chicago and New York are fleeing south for Dallas24 Jun, 2019