Blog

Oct
Allergies—a health condition whereby the immune system is negatively impacted by foreign particles or substances—are a public nuisance. These substances can be found in cities across the nation; however, some places have a significantly higher amount than others.
The Asthma and Allergy Foundation of America (AAFA) conducted a comprehensive study to identify where allergies are the worst during the Fall season. The actually listed 100 cities, which you’ll see at the end of this article.
AAFA’s Criteria for Inclusion
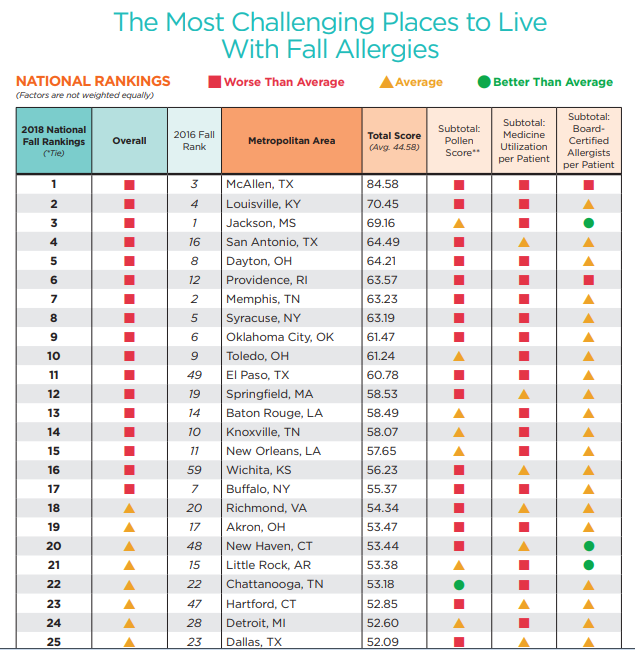
How did the AAFA determine which cities made the cut, and which didn’t? They describe it in detail: “The ranking is based on analysis of data from the 100 most-populated Metropolitan Statistical Areas (MSAs) in the contiguous 48 states. The three (3) individual factors analyzed for the 2018 rankings are: seasonal (Fall) pollen score, medication use (allergy) and number of allergy specialists. For each factor, AAFA used the most recently available calendar year data. Weights are applied to each factor; factors are not weighted equally. Total scores are calculated as a composite of all three factors.”
Tips for Allergy Prevention
The AAFA provides actionable tips which will help you avoid or reduce your allergies. The recommend wearing sunglasses outdoors, removing shoes in the home, and keeping windows closed. If you have carpeting, regular vacuuming will reduce allergens in your home. Bed sheets should also be cleaned on a regular basis.
The AAFA also recommends “CERTIFIED asthma & allergy friendly” products such as cleaning supplies. You can also find allergy-friendly bed mattresses and HVAC filters. The more allergy friendly products you own, the better chance you have at mitigating the presence of allergies in your home.
The Top 100 Cities with Fall Allergies
The cities below are ranked from worst to best as the “most challenging places to live with fall allergies”.
- McAllen, TX
- Louisville, KY
- Jackson, MS
- San Antonio, TX
- Dayton, OH
- Providence, RI
- Memphis, TN
- Syracuse, NY
- Oklahoma City, OK
- Toledo, OH
- El Paso, TX
- Springfield, MA
- Baton Rouge, LA
- Knoxville, TN
- New Orleans, LA
- Wichita, KS
- Buffalo, NY
- Richmond, VA
- Akron, OH
- New Haven, CT
- Little Rock, AR
- Chattanooga, TN
- Hartford, CT
- Detroit, MI
- Dallas, TX
- Birmingham, AL
- Philadelphia, PA
- Columbia, SC
- Columbus, OH
- Tulsa, OK
- Greenville, SC
- Albany, NY
- Grand Rapids, MI
- 21 Cleveland, OH
- Pittsburgh, PA
- Charleston, SC
- New York, NY
- Scranton, PA
- Miami, FL
- St. Louis, MO
- Bridgeport, CT
- Austin, TX
- Allentown, PA
- Las Vegas, NV
- Omaha, NE
- Greensboro, NC
- Winston-Salem, NC
- Augusta, GA
- Virginia Beach, VA
- Cape Coral, FL
- Houston, TX
- Jacksonville, FL
- Fresno, CA
- Tucson, AZ
- Madison, WI
- Cincinnati, OH
- Nashville, TN
- Chicago, IL
- Rochester, NY
- Riverside, CA
- Charlotte, NC
- Indianapolis, IN
- Orlando, FL
- Des Moines, IA
- Los Angeles, CA
- Modesto, CA
- Lakeland, FL
- Minneapolis, MN
- Harrisburg, PA
- Kansas City, MO
- Albuquerque, NM
- Tampa, FL
- Durham, NC
- Worcester, MA
- Oxnard, CA
- Atlanta, GA
- Milwaukee, WI
- Baltimore, MD
- Bakersfield, CA
- Phoenix, AZ
- Boston, MA
- Palm Bay, FL
- Washington, DC
- San Diego, CA
- Spokane, WA
- Stockton, CA
- Daytona Beach, FL
- Sarasota, FL
- Raleigh, NC
- Sacramento, CA
- Salt Lake City, UT
- San Francisco, CA
- Ogden, UT
- Colorado Springs, CO
- Seattle, WA
- San Jose, CA
- Boise, ID
- Portland, OR
- Provo, UT
- Denver, CO
Featured image by Public Domain Pictures on Pexels
AAFA city allergies chart photo is a screenshot by RPS Relocation

Oct
The Top 20 Cities to Move to For Startup Founders
Jason C. 0 comments Data Visualization, Moving News
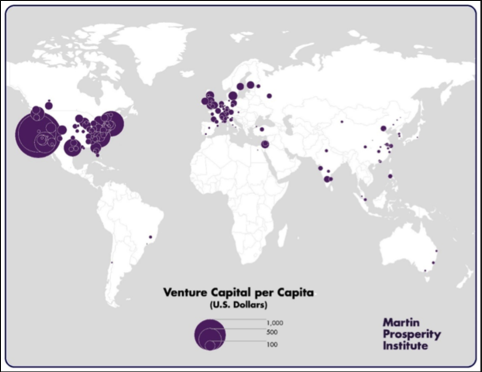
Follow the money! Venture capital investment isn’t equally dispersed; instead, large amounts of it go to a limited number of countries around the world. If you have any interest in working at an emerging firm, you’d do well to move to an area where these firms are plentiful.
Richard Florida of Business Insider reported on the flow of venture capital around the world. Specifically, he created a list of the top twenty metropolitan cities that see the most amount (in dollars) of venture capital. They are:
San Francisco
San Jose
Boston
New York
Los Angeles
San Diego
London
Washington
Beijing
Seattle
Chicago
Toronto
Austin
Shanghai
Mumbai
Paris
Bangalore
Philadelphia
Phoenix
Moscow
America in the Lead
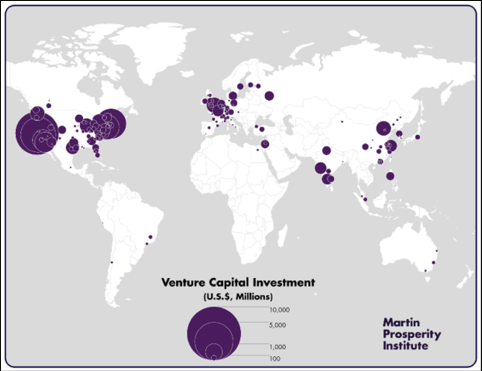
As you can see from the map, America has the highest concentration of major venture capital investment. Richard Florida writes “the U.S. is the world’s dominant center for venture capital, accounting for nearly 70 percent (68.6 percent) of total global venture capital, followed by Asia and Europe with roughly 14 percent each (14.4 percent for Asia and 13.5 percent for Europe).”
Given our wealth as a nation, it’s not much of a surprise there are so many American cities on the list. Perhaps the most interesting is that there are two cities in India that are on the list: Bangalore and Mumbai.
Looking at the map shows there isn’t much venture capital investment in Latin America, comparatively. That also goes for Canada, Eastern Europe Africa, Southeast Asia, and Australia.
Taking City Size into Consideration
There’s another way to look at the flow of venture capital. Instead of viewing the total invested in a certain area, you can look at investments on a per capita basis. The updated top twenty list is shown below:
San Jose
San Francisco
Boston
Durham
San Diego
Austin
Seattle
Washington
Jacksonville
Los Angeles
New York
Toronto
Salt Lake City
Madison
Greensboro
New Haven
Denver
Oxnard, CA
Providence, RI
Phoenix
The cities are mixed up and you see some newcomers like Phoenix, Oxnard, and Providence. As a matter of fact, most of the newcomers are more American cities. Most foreign countries have dropped out of this top twenty list entirely. As a matter of fact, only one foreign city remains on this new list: Toronto. And Toronto is close enough in proximity to New York to be considered “foreign” if we think in terms of a place as far as Beijing or Mumbai.
Richard Florida writes “Outside of the U.S., Toronto is the only metro to make the top twenty. London, which ranked 7th on overall venture investment, drops down to 39th. Beijing, which ranked ninth in overall venture investment, now drops to 55th. And Mumbai, ranked 15th overall, drops to 70th when accounting for population. Other notable metros that fall out of the top 20 are Paris (53rd), Bangalore (43rd), and Shanghai (74th).”
Looking at the map, it doesn’t appear much has changed. The “heat map” shows a greater intensity on the American west coast and a smaller intensity on the eastern coast. However, there’s one major similarity between both maps: Venture capital is flourishing in America.
Featured image by rawpixel.com on Pexels
Venture capital map photos are screenshots by RPS Relocation

Sep
One of the reasons people relocate is to chase an opportunity. Another reason is for them is to enjoy a heightened quality of life. The better quality of life may include lower crime, increased affordability, or a larger number of amenities offered by the city or local organization. MONEY, a division of Time Magazine, put together a list of the 50 greatest places to live in America. Here are their top ten picks:
- Frisco, Texas
- Ashburn, Virginia
- Carmel, Indiana
- Ellicott City, Maryland
- Cary, North Carolina
- Franklin, Tennessee
- Dublin, California
- Highlands Ranch, Colorado
- Sammamish, Washington
- Woodbury, Minnesota
Criteria to Make the List
The list—which features cities from all over the country—is governed by nine categories. They are:
- Economy
- Cost of Living
- Diversity
- Education
- Income
- Housing
- Crime
- Amenities
- Ease of Living
Having this many categories allowed MONEY to conduct a comprehensive analysis in support of their findings. In addition, they write “we looked only at places with populations of 50,000 or greater. We eliminated any place that had more than double the national crime risk, less than 85% of its state’s median household income, or a lack of ethnic diversity. This gave us 583 places.” Narrowing the criteria by these small factors meant that only 8.5% of cities would be chosen.
With regards to home prices, MONEY needed to find a partner with access to a database of nation-wide prices. So they teamed up with Realtor.com. Realtor.com—an online real estate broker—was the perfect answer to MONEY’s problem. The real estate broker was able to grant access to home prices in virtually every city across the country.
There are two places I’d like to focus on due to their close proximity to the cities we serve. Frisco, TX is near Dallas and Sammamish, WA is near Seattle. Let’s start with Frisco.
The Greatest Place: Frisco, TX

There’s another bonus to talking about Frisco, TX: It ranks number one on the list! Frisco excels in every category of criteria. MONEY writes Frisco is “a sleepy bedroom community of 6,500 people as recently as 1990, the city today houses around 180,000 residents. Jobs are projected to grow by nearly 15% over the next four years, according to Moody’s Analytics, and companies from T-Mobile to Oracle have offices in the city.” Here’s what this means: People are flocking to Frisco and there’s no indication its popularity will wane anytime soon.
Frisco is also a great place for growing families. Indeed, public schools in the city have “the highest graduation rate of all the cities and towns MONEY evaluated this year.”
A Tech and Outdoors Haven: Sammamish, WA
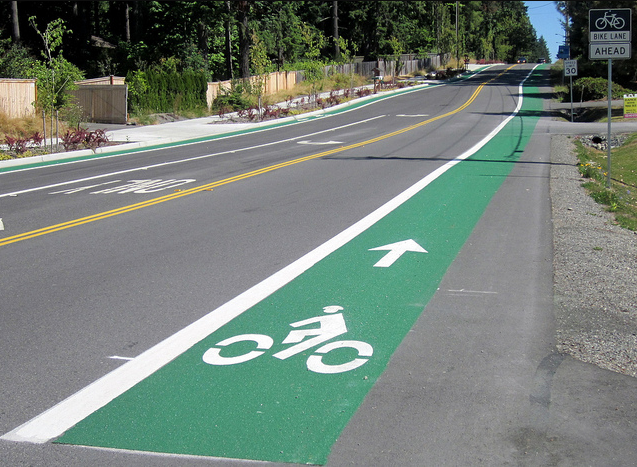
Sammamish also ranks very highly on the list, coming in at number nine. When people think about tech companies, they think “Silicon Valley” which is located in California; however, Sammamish “attracts many of the people who work for Microsoft, Amazon, Expedia and other tech giants.” Like Silicon Valley, the home prices are relatively expensive. But here’s the good news: salaries are relatively high as well.
Culture and recreational living flourish in Sammamish. The city has fourteen parks and nature preserves which are populated by diverse wildlife. Sammamish is also home to regular concerts and exhibitions.
Take a look at other places on the list. If you’re interested in relocation anywhere, make sure you use our form to get a free moving quote.
Featured image by Pixabay on Pexels
Farmers market and bike lane photos are screenshots by RPS Relocation

Sep
Homelessness is an unfortunate circumstance that shouldn’t be wished upon anyone. Cities, states, and countries each use different methods in the attempt to combat it. Companies and other organizations, such as volunteer or church groups, also look for ways to decrease the number of homeless. GlobalHack—a social-focused technology group—is one of these groups.
GlobalHack is headquartered in St. Louis and was founded in 2013. Their mission is to “organize events that kickstart community-focused software projects and deliver accessible computer science education opportunities for kids.” Speaking of St. Louis, St. Louis Magazine ran a story detailing GlobalHack’s recent hackathon.
GlobalHack VI
GlobalHack VI took place in October 2016. “Hackathons are events in which Red Bull–fueled programmers, designers, and other technologists are given a limited period in which to collaborate and develop software projects.” The goal of GlobalHack VI was to identify software which would improve the lives of the homeless. The winning team receives a cash prize. They win $250,000! In addition, an extra $750,000 was divided between other divisions and teams that took part in the event.
GlobalHack expected 1,500 people to attend the event. With those numbers and the experiences of those attending, it’s no surprise that corporate sponsors also wanted to be present. After all, the event was a great opportunity for companies to find potential employees.
Evolving Objectives
GlobalHack VI was geared towards helping the homeless; however, prior hackathons had different focuses. “This is GlobalHack’s second consecutive contest focused on a civic-minded project; last year’s hackathon sought ways to improve the transparency in St. Louis County’s criminal justice system. Earlier contests were aimed at building proprietary software for corporate sponsors, including LockerDome and Emerson.”
The changing goals of the hackathons are a nimble way for GlobalHack to stay most relevant. For example, one year there may be an epidemic of drugs in St. Louis. GlobalHack could, therefore, decide to hold the hackathon with the purpose of preventing drug abuse. Or let’s say that one year the city suffers a rise in gang violence. GlobalHack could make that year’s hackathon focused on combating gang violence and giving relief to those affected.

Future Hackathons
There’s no telling what social cause GlobalHack will confront next year or even further in the future; however, this year’s event has been announced: GlobalHack VII! This hackathon will focus on serving the needs of immigrants living in St. Louis. “GlobalHack – in partnership with Casa de Salud, The International Institute, The St. Louis Mosaic Project and the Immigrant Service Providers Network (ISPN), among others – will host a hackathon to reshape the experiences of foreign-born individuals and communities.”
The event will be held on Saint Louis University campus in Chaifetz Arena this October 12-14. Like prior hackathons, there will be cash prizes! This time, they will be divided between the following divisions: youth, college, and professional.
We would like to wish all teams good luck. And we would like to give a special thanks to GlobalHack as they continue to improve the lives of those living in St. Louis and surrounding areas.
Featured image by rawpixel.com on Pexels
St. Louis Magazine photos are screenshots by RPS Relocation

Sep
“The world is getting smaller” has become popular phrase due to globalization. But here’s the truth: the square footage of the world isn’t changing; however, new homes are getting bigger, at least in America.
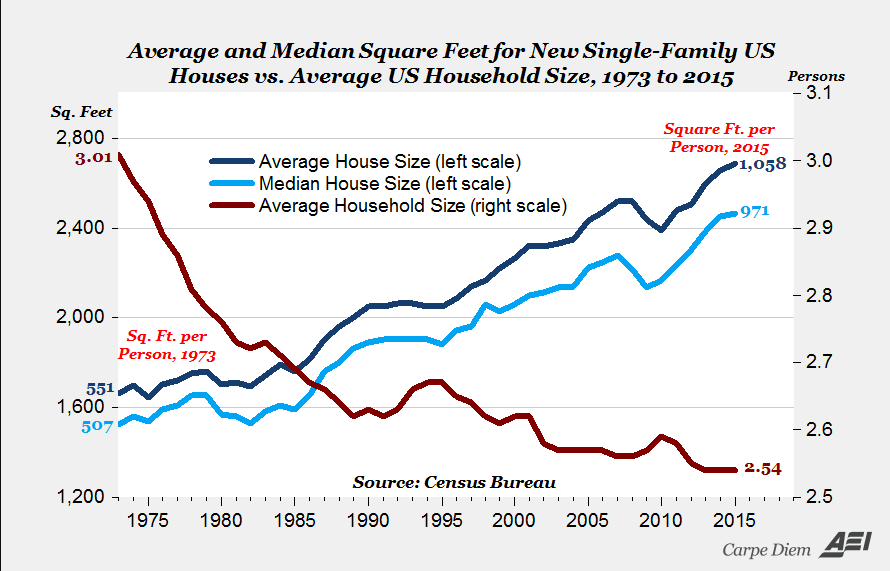
The American Enterprise Institute recently shared some surprising information about changes in home size, square footage costs, and living space per person.
Average New Home Size
Mark J. Perry—economics professor and author of the article—writes “the median-size house has increased in size by almost 1,000 square feet, from 1,525 square feet in 1973 to 2,467 last year. In percentage terms, both the average and median size of new US houses have increased by 62% since 1973.”
Here’s what that means: if the trend were to continue, the square footage of new homes will have more than doubled within a 100-year time period! What happened to the “people today are making less than their parents did” debate? While there’s truth to that side, that fact that new homes are increasing so much in size makes it seem people today have more money.
The chart below shows the climb in square footage of new homes in 1973. Notice the dip from around 2008 until 2011. The short decline in total square footage for new homes during those years is likely to what’s now known as the Great Recession of 2008.
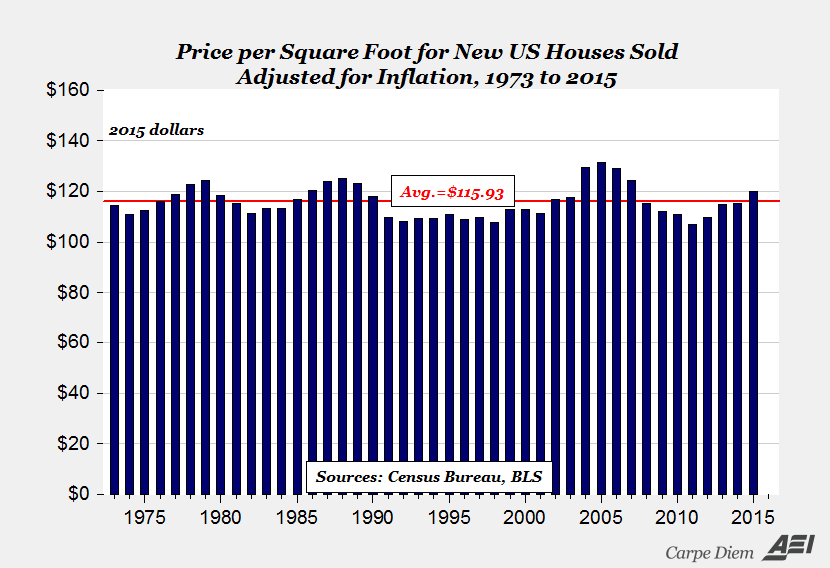
Cost per Square Foot
With the square footage in homes doubling since 1973, one would presume the cost per square footage is now less expensive. But that’s not the case. As a matter of fact, the price per square feet has relatively stayed the same, even considering inflation. At least the price hasn’t gone up!
Mr. Perry writes that the prices “range between about $107 and $128 per square foot at an average of about $116. The price of just more than $120 per square foot for new houses sold in 2015 was 8.5% below the peak of $131.29 (in 2015 dollars) per square foot for a new house in 2005.”
The graph below visualizes the price per square footage since 1973.
Living Space per Person
Is the average new home getting larger because more people are living under the same roof? The answer is no. As a matter of fact, people today have more square footage than they did in 1973.
Mr. Perry breaks down exactly how much more square footage each person has now, on average. He writes the “square footage of living space per person in a new US house has increased from 507 to 971 square feet using the median size house, and from 551 to 1,058 square feet using the average size house. In percentage terms, that’s a 92% increase for both the median or average house size per person.”
Final Thoughts on Living Space
Mr. Perry finishes his article on a lighter note. He explains that focusing on stagnating wages and decreasing household incomes do not paint the entire picture of our economy. Instead, he points to our overall quality of life improving since the 1970s, which is made apparent in the additional square footage we have and the price remaining about the same.
Featured photo by Sarah Jane on Pexels
American Enterprise Institute graph photos are screenshots by RPS Relocation

Sep
What does a nation do if it has too much food? The phrase “too much food” is a bit of a misnomer. After all, too much food is actually a good thing. World hunger is alive and well. In addition, people go hungry right here in the United States due to reasons associated with poverty. This shouldn’t happen because there is an excess of food on a daily basis.
Think about restaurants that don’t sell all of their food by the end of the day. Where does that food go? Often times, it’s simply thrown out with the garbage. Other times, it’s donated. The Environmental Protection Agency has mapped out where opportunities exist to save excess food.
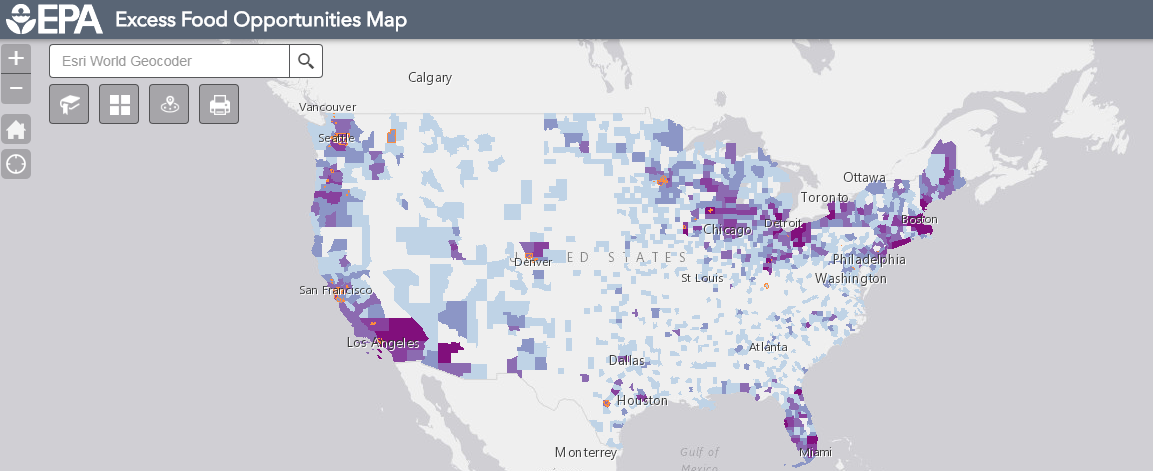
About the Food Opportunities Map
“The U.S. EPA Excess Food Opportunities Map supports nationwide diversion of excess food from landfills. The interactive map identifies and displays facility-specific information about potential generators and recipients of excess food in the industrial, commercial and institutional sectors and also provides estimates of excess food by generator type.”
Food banks, correctional facilities, educational institutions, composting facilities—these are some of the establishments you’ll find by exploring the interactive map. A quick glance of it shows a “heat map” of where these establishments are. There are ample establishments up and down the West Coast. On the other side of the country, Florida seems to have a good amount. Elsewhere, the Upper Midwest and stretching to the Upper East Coast show numerous establishments.
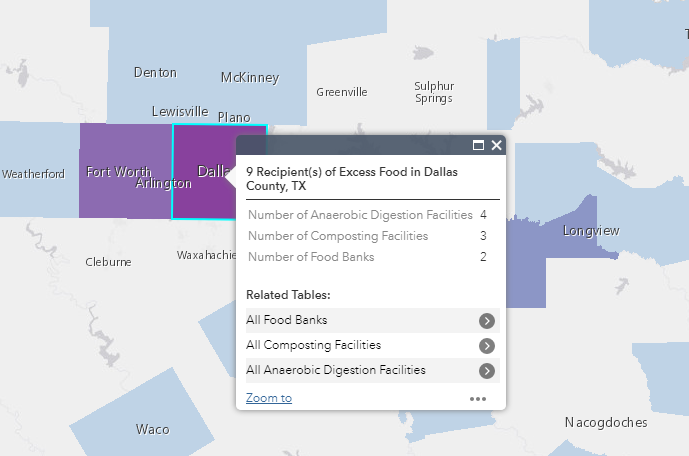
Food Opportunities in Dallas
According to the EPA’s map, there are currently nine excess food opportunities in Dallas. The photo below shows the institutions are sorted by anaerobic digestion facilities, composting facilities, and food banks. Dallas has 4 anaerobic digestion facilities, 3 composting facilities, and 2 food banks. You’ll see a similar list any time you click another area on the map.
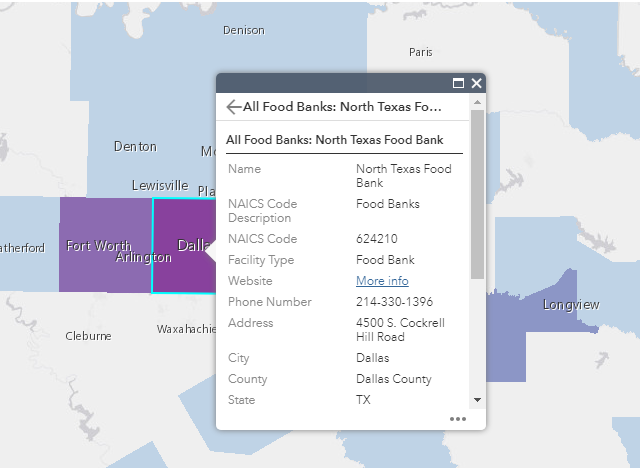
Clicking through the facility type will show you the actual facility or food bank. For example, the North Texas Food Bank is one of them. It shows the address and phone number of each facility. The amount of food received per year is even listed. The North Texas Food Bank received 26,453.44 tons of food. That can feed a lot of people!
Goals of the Food Opportunities Map
The EPA created the map in part to let establishments know where to find these facilities. The EPA wants less food to be wasted and more excess food to be donated. They say that the “map will help you learn about potential sources of excess food in your region and potential non-landfill recipients, such as composting and anaerobic digestion facilities.”
The EPA also wants to highlight the “potential infrastructure gaps for managing excess food”. Managing excess food requires logistics to get the food to a facility where it can be donated. At a larger level, the EPA perhaps wants to highlight where a facility isn’t. If there is an area with a high amount of excess food, there should be a facility such as a food bank. That way, we can put more excess food to better use.
Featured photo by Daria Shevtsova on Pexels
EPA food opportunities map photos are screenshots by RPS Relocation
Aug
How Much Time Residents Of Major USA Cities Waste Commuting In Their Lifetime
Jason C. 0 comments Dallas, Data Visualization, Maps, Seattle
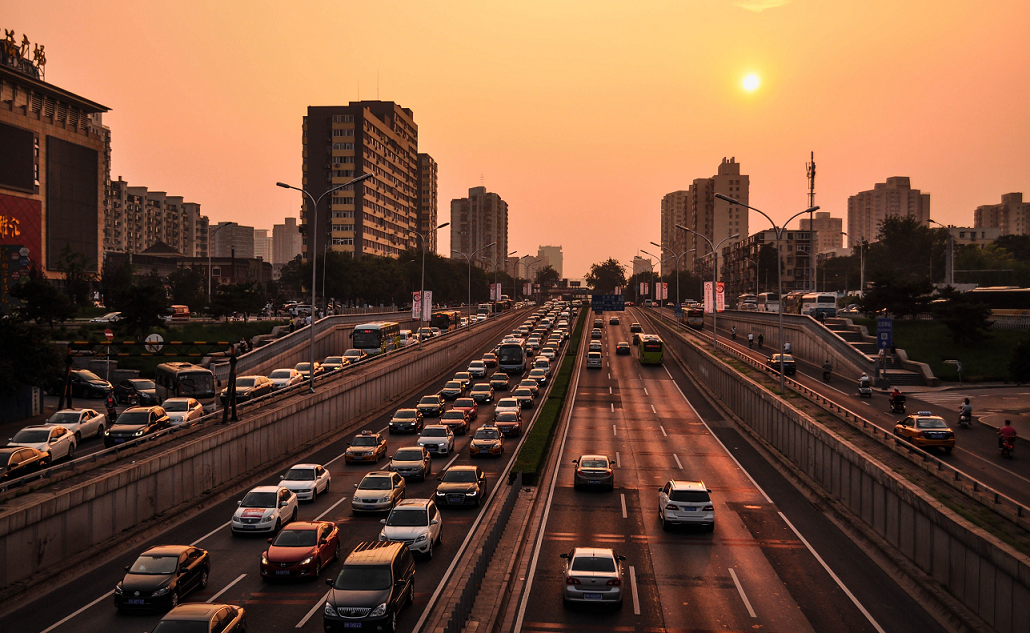
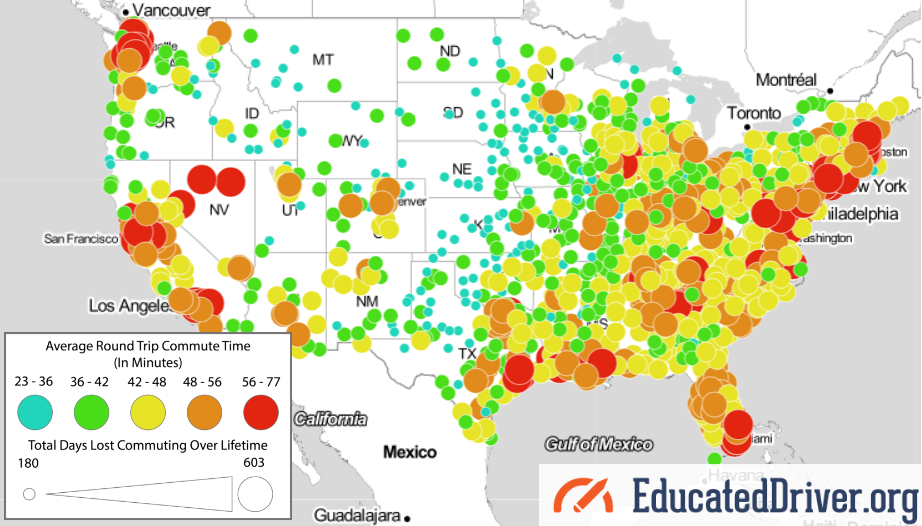
How much time do you spend driving? If you live in or near a major city, the answer is probably “a lot”. EducatedDriver.org has put together a data visualization map which details the average round trip commute time that may affect you.
Alex Lauderdale, the author of the article, writes “We did the math for nearly 1,000 US cities. The average American loses 408 days of their life commuting, and in many areas, the toll is even higher.” Let’s dig a little deeper and look at some individual cities listed.
Here’s How Much Time You’ll Waste Commuting in Your Lifetime (by City)
The Cities We Serve
Here at RPS Relocation, we focus on offering a great relocation experience in Dallas, Seattle, Las Vegas, and Boulder; so we’ll use them as examples. What is the average commute time like in each of these cities? We’ve sorted them from worst to best, starting with Seattle which is the worst on this map.
Seattle, WA — Seattle has one of the worst average round trip commute times in the country. If you look closely at the visualization, the city is marked by a red circle which stands for the longest commutes. Indeed, a commuter in Seattle will spend 463 days of their life on the road. The average round trip commute time is 59.2 minutes.
Dallas, TX — Dallas is orange on the map, which is one step better. A commuter in the city will lose 436 days of their life by driving in or around it. The average round trip commute time in Dallas is 55.8 minutes. Dallas must have just missed being in the red due to its close proximity to the commuting times Seattle drivers have to deal with.
Las Vegas, NV — Las Vegas, like Dallas, is also in the “orange zone”. A commuter in Sin City will spend 381 days of their life on the road. The average round trip commute time in Las Vegas is 48.8 minutes.
Boulder, CO — Out of the four cities, drivers in Boulder have it the best. The city is right in the middle when it comes to average commute times. The area is marked by a yellow circle. A driver in Boulder will lose 350 days of their life to commuting. That’s just under one year! The average round trip commute time in Boulder, CO is 44.8 minutes.
Other Major or Growing Cities
Major cities in red on the visualization map seem to be the largest in the country. Many of the ones in yellow seem to be growing or up-and-coming cities. Austin, Charlotte, and Denver come to mind. For the remainder, take a glance at where these cities stand with regards to the average round trip commute time. The number after each city is the round trip time in minutes.
Red Circle
New York 71.8
Washington D.C. 68.8
Chicago 64.4
San Francisco 64.2
Boston 64
Philadelphia 63
Miami 61.2
Los Angeles 60.8
Houston 59
Orange Circle
San Jose 54.6
Denver 54.6
Nashville 54
Detroit 53.4
Austin 52.8
Jacksonville 52.6
Charlotte 52.6
Portland 52.4
Phoenix 52
San Antonio 51.4
San Diego 50.6
Yellow Circle
Kansas City 45.8
Oklahoma City 44.8
Featured photo by Pixabay on Pexels
EducatedDriver.org data visualization map photo is a screenshot by RPS Relocation

Aug
Parts of Dallas are getting hotter over time and it’s largely due to human actions. I’m not talking about climate change or other atmospheric alterations. Instead, trees are being cut down as a result of continuous urban development.
There are a host of problems that develop as a result of removing a large number of trees. One is that healthy oxygen levels would decrease since trees emit the compound. Trees also absorb unhealthy compounds such as carbon dioxide which is commonplace in urban areas. Still, another issue with removing trees is the lack of shade, especially in areas around Dallas.
Citilab detailed how Dallas-area residents have gotten tired of the growing “heat islands” and have begun fighting back.
The Planter Organizations
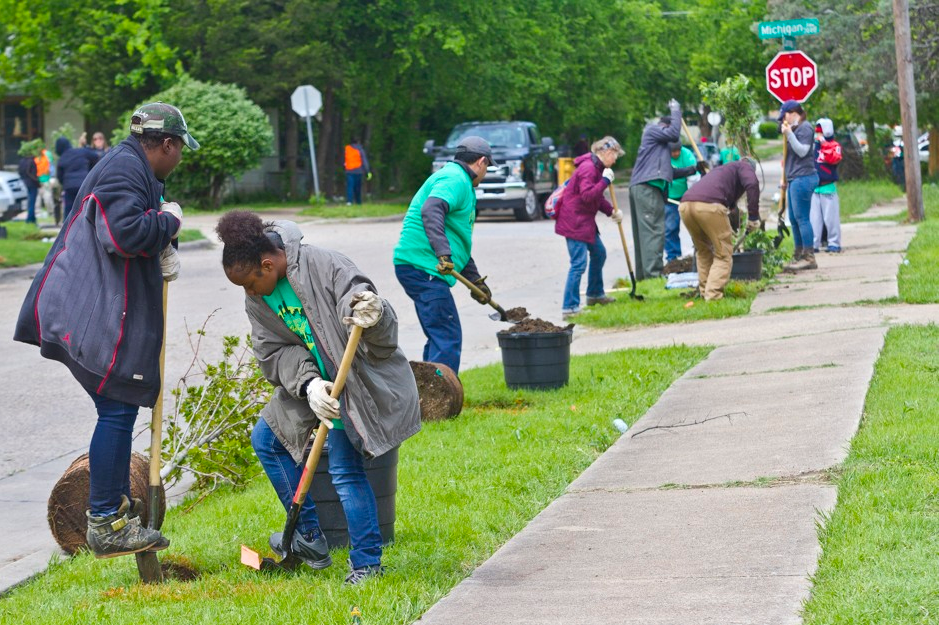
The residents have banded together under the banner of three different organizations: Texas Trees Foundation, The Nature Conservancy, and Trust for Public Land. Each of these groups plays a part in restoring trees in various neighborhoods. And there’s one neighborhood in particular that needs an added level of attention: Oak Cliff.
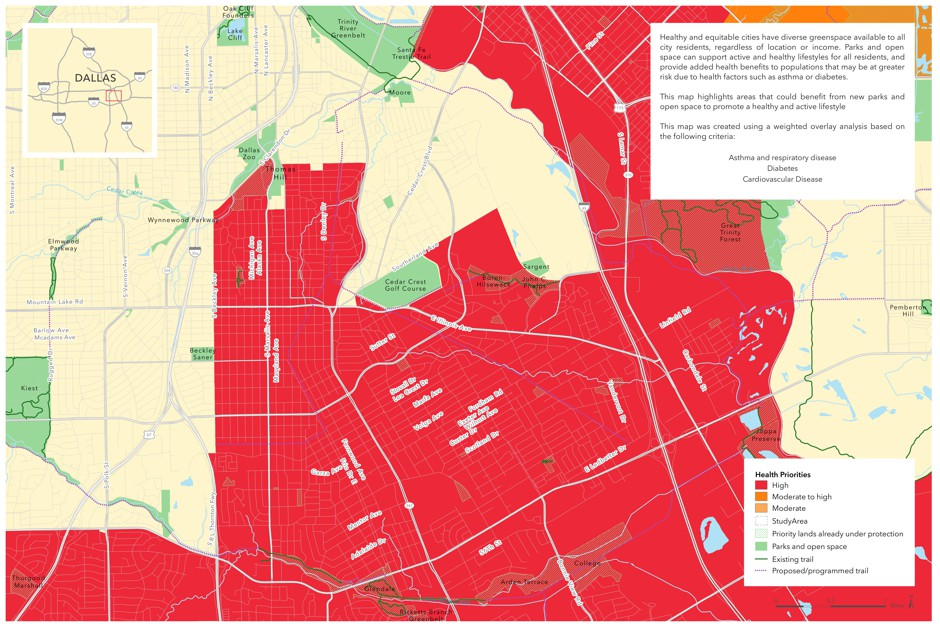
Oak Cliff, as seen in the map below, is a high-risk neighborhood for heat-related problems. Asthma, diabetes, cardiovascular disease—these are common health consequences of living in a poor environment.
“The goal is to eventually plant 1,000 trees; so far, some 500 saplings are in the ground as part of a project called Cool and Connected Oak Cliff. Planting trees is a common low-tech solution to battle the heat island, but high temperatures are just one target of this ambitious project.”
Planning the Habitat
The Texas Trees Foundation originally used aerial imagery to map where the trees were around Dallas. They studied different neighborhoods and found temperature differences in areas with trees versus those without. This was noted in their “report on urban heat management in the city, which suggested that trees could help curb temperatures by as much as 15 degrees on hot days”.
The Trust for Public Land did their part with the data as well. They ran it through a “visual mapping program, overlaying the numbers with additional data on the socioeconomic and health status of Dallas’s neighborhoods.”
Side Benefits of More Trees
Cleaner oxygen is only one benefit of living around many trees. Others include shade for playgrounds and places with high foot traffic. Trees foster an increase in the safety of pedestrians who walk near roads. Robert Kent at the Trust for Public Land says “not only provides a physical barrier of separation, but the tree will also be a signal to drivers to slow down”.
Future Goals
Cool and Connected Oak Cliff has already surpassed half of their goal; however, planting 1,000 trees is only a drop in the ocean. “The Texas Trees Foundation’s report suggests that the city will need to increase its tree canopy by about 5 percent to make a dent in curbing the heat island effect. That can mean roughly 300,000 trees.” That being said, the positive results from the new, growing trees may prompt more calls to grow even more trees.
Featured photo by Anton Atanasov on Pexels
Oak Cliff map and tree planters photo are screenshots by RPS Relocation

Aug
Homelessness is an ongoing problem for many people and communities. Mental illness, poverty, domestic abuse, laziness—these are some common reasons people become homeless. Statista recently created the chart below which details the cities that have the highest number of homeless people.
 You will find more infographics at Statista
Interpreting the Numbers
A quick glance at the chart shows a shocking number of homeless people. Half a million people would fill ten major sports arenas! Digging a little deeper, however, shows that the number is comparatively small compared to how many people there are in the United States. The United States Census Bureau states that the population is just over 328 million. That means only 0.17% of people here are homeless. While the percentage is small, it’s still about 0.17% too much.
The Census Bureau also lists the most populous states. Four of them, in order, are California, Texas, Florida, and New York. How does this match up with our chart? Four of the ten are cities in California. New York, while only having one city in the chart (New York City), is by far the winner (or loser) when it comes to the highest number of homeless people that live in any particular state.
Percentages Against Total Number of Homeless
Statista lists the ten cities with the highest number of homeless. Adding those numbers will net 192,535 homeless people, which is nearly 35% of the total homeless in the United States. This makes sense since we learned earlier that California and New York, a couple of the most populous states, have cities with a high number of homeless people.
Let’s take a look at how the ten cities compare again the total number of homeless.
Total Number of Homeless: 553,742.
- Philadelphia: 1%
- Boston: 1.1%
- Las Vegas/Clark County: 1.2%
- San Francisco: 1.2%
- San Jose/Santa Clara City & County: 1.3%
- District of Columbia: 1.3%
- San Diego City and County: 1.7%
- Seattle/King County: 2.1%
- Los Angeles City & County: 10%
- New York City: 13.8%
What’s striking here is that most of the cities seem to have similar percentages. Statistically, Los Angeles and New York City see large jumps and can be considered the outliers of the sample. However, we need to take into consideration that those two cities are massively larger than the others in terms of size and population.
Percentages Against Total Number of Homeless Within Top Ten
Another way of looking at the data is to compare the numbers within each other. For this we won’t take into consideration the total number of homeless; however, we’ll use 192,535. As we learned earlier, that is the sum of the number of homeless from each of these ten cities. Here’s what we get:
- Philadelphia: 3%
- Boston: 3.2%
- Las Vegas/Clark County: 3.4%
- San Francisco: 3.6%
- San Jose/Santa Clara City & County: 3.8%
- District of Columbia: 3.9%
- San Diego City and County: 4.8%
- Seattle/King County: 6%
- Los Angeles City & County: 28.7%
- New York City: 39.7%
While Los Angles and New York City are still the outliers, this gives us a somewhat clearer picture of the data. The two large cities command roughly 68.4% of the total homeless within the top ten cities.
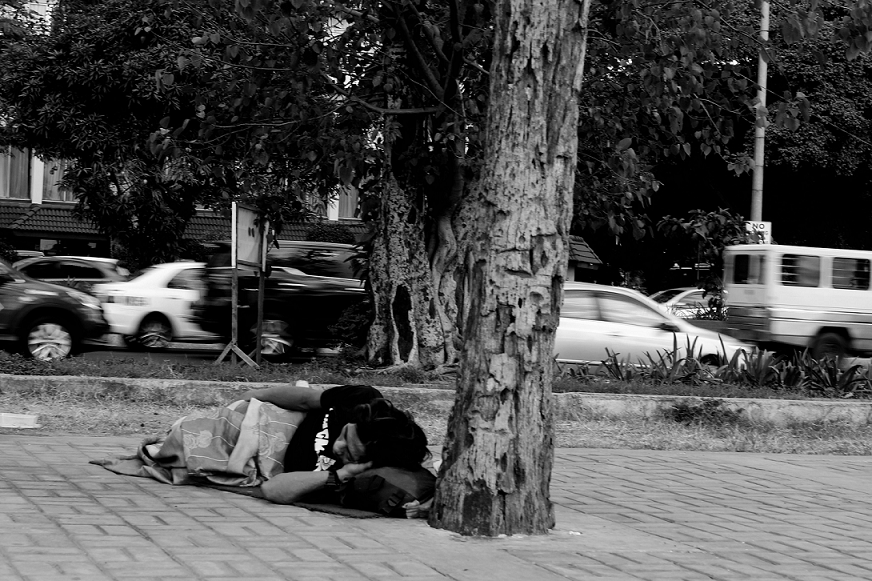
Featured photo by Pixabay and sleeping homeless man photo by Alvin Decena on Pexels
Aug
How does a neighborhood get its name? Often times, the political establishment will christen it. Other times, the residents of the area will name it. More recently, new names for neighborhoods have popped up on Google Maps. The New York Times recently dug a little deeper to find out why.
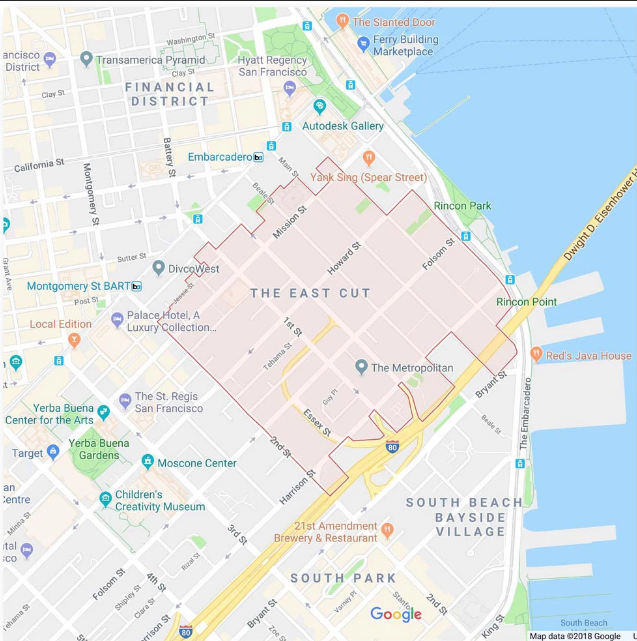
The East Cut
Imagine this: you live in the same neighborhood your whole life. Let’s say it’s called Old Town. Then, an acquaintance tells you to meet them down the street at an establishment in the “East Cut” neighborhood. You’ll have to ask for clarification because surely there’s no such place. The acquaintance pulls up Google Maps on their smartphone and proves it to you.
It may seem like the Twilight Zone to some; however, that’s exactly what happened earlier this spring. The New York Times writes “For decades, the district south of downtown and alongside San Francisco Bay here was known as either Rincon Hill, South Beach or South of Market. This spring, it was suddenly rebranded on Google Maps to a name few had heard: the East Cut.”
Typos and Mistakes
One would assume a platform like Google Maps would have precise spelling; however, that isn’t the case if the name submitted was misspelled in the first place. Arthur Mullen, a former city planner in Detroit, created a map as a side project back in 2002. His map, which was eventually posted online by locals, contained typos.
Timothy Boscarino, another city planner in Detroit, advised that Google Maps has incorporated Arthur Mullen’s map. “Google almost identically copied that map’s neighborhoods and boundaries, he said — down to its typos. One result was that Google transposed the k and h for the district known as Fiskhorn, making it Fishkorn.”
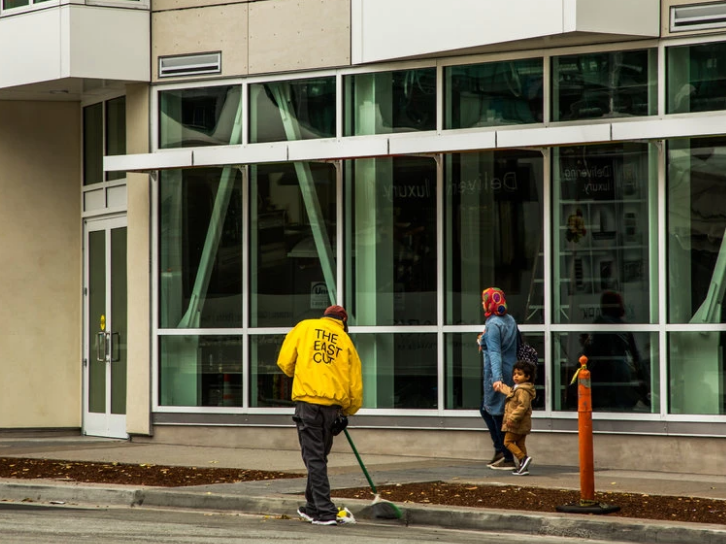
Here’s the problem with typos and mistakes: they spread from Google Maps to other online platforms. With regards to the East Cut, the “peculiar moniker immediately spread digitally, from hotel sites to dating apps to Uber, which all use Google’s map data. The name soon spilled over into the physical world, too. Real-estate listings beckoned prospective tenants to the East Cut. And news organizations referred to the vicinity by that term.”
How the Naming is Established
Google isn’t always clear with how they name or rename neighborhoods; however, we can presume that they do so with information already found online. This seemed to be the case after Arthur Mullen’s map appeared online.
The New York Times writes “The company declined to detail how some place names came about, though some appear to have resulted from mistakes by researchers, rebrandings by real estate agents — or just outright fiction.” The story of Jeffrey Schneider all but confirms this.
Jeffrey Schneider, an architect based in Los Angeles, owned a rental apartment. He wanted a new tenant so he ran some ads to make the available unit known. He decided, partly as a joke, to name his neighborhood “Silver Lake Heights”. In reality, the area he lived in was called only Silver Lake. Google Maps got a hold of the name ” Silver Lake Heights” and it began appearing on the platform.
Featured photo by Pixabay on Pexels
The East Cut map and photo are screenshots by RPS Relocation
Most Recent Blog Posts
 A Dallas Area Home Buyer Had to Pay $300,000 More Than Asking Price For Their New Home22 May, 2021
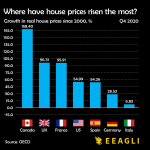
- Canada's Home Prices Have Risen 168.4% Since 2000, USA Home Prices Have Risen 54.99%01 Apr, 2021
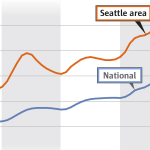
- Home Prices in Seattle Are Skyrocketing12 Mar, 2021
- Seattle Among Best Cities for Startups08 Jul, 2019
- Renters in Chicago and New York are fleeing south for Dallas24 Jun, 2019