Blog

Dec
Best U.S. Cities for New Year’s Eve Celebrations
Joe Youngblood 0 comments Dallas, Maps, Seattle
Get ready for 2019! In celebration of the new year, we decided to write about the best cities for New Year’s Eve celebrations. WalletHub compiled multiple data points in numeous cities to determine which ones made the cut.
Methodology of Choosing Cities
Adam McCann of WalletHub writes they used “three key dimensions: 1) Entertainment & Food, 2) Costs and 3) Safety & Accessibility. We evaluated those dimensions using 28 relevant metrics. Each metric was graded on a 100-point scale, with a score of 100 representing the most favorable conditions for New Year’s Eve partiers.”
Among the 28 metrics, some are:
- New Year’s Eve Events per Capita
- Duration of 2018 Fireworks Show
- Availability of Affordable Fine Dining
- Average Alcoholic Beverage Price
- Traffic Congestion
- Neighborhood Security
The 100 Best Cities
Using the 28 metrics, WalletHub was able to rank the top 100 cities. Let’s talk about the top five in order. They are: New York, Los Angeles, Atlanta, San Diego, and Las Vegas.
New York has the world-famous Times Square celebrations; however, the celebrations of the other top cities are lesser known. Near Los Angeles, the EVE party at Universal Studios Hollywood is popular. In Atlanta, the popular Peach Drop emulates the ball drop in Times Square. Big Night San Diego is a popular New Year’s Eve party event. And in Las Vegas, 40,000 people watch multiple simultaneous fireworks shows from the downtown area.
Numerous cities in Texas, and Seattle, also ranked highly on the list. In Texas, some of the best cities are: San Antonio (#16), Dallas (#17), Houston (#22), Austin (#27), El Paso (#35), and Fort Worth (#46). Seattle clocks in fairly high at #15.
See the full list of the best U.S. cities for New Year’s Eve celebrations below. Have you attended a New Year’s Eve celebration in one of the cities below? We’d love to hear about your experience.
- New York, NY
- Los Angeles, CA
- Atlanta, GA
- San Diego, CA
- Las Vegas, NV
- Denver, CO
- Orlando, FL
- Chicago, IL
- Washington, DC
- San Francisco, CA
- Miami, FL
- New Orleans, LA
- Philadelphia, PA
- Birmingham, AL
- Seattle, WA
- San Antonio, TX
- Dallas, TX
- Louisville, KY
- Nashville, TN
- Virginia Beach, VA
- Tampa, FL
- Houston, TX
- Portland, OR
- Indianapolis, IN
- Pittsburgh, PA
- Buffalo, NY
- Austin, TX
- Cincinnati, OH
- Tucson, AZ
- Minneapolis, MN
- Scottsdale, AZ
- Sacramento, CA
- Baltimore, MD
- Raleigh, NC
- El Paso, TX
- Anaheim, CA
- Boston, MA
- Honolulu, HI
- Milwaukee, WI
- Charlotte, NC
- St. Louis, MO
- Omaha, NE
- Madison, WI
- Irvine, CA
- Long Beach, CA
- Fort Worth, TX
- Phoenix, AZ
- Greensboro, NC
- Detroit, MI
- Oklahoma City, OK
- Henderson, NV
- Reno, NV
- Columbus, OH
- Colorado Springs, CO
- St. Paul, MN
- Boise, ID
- Durham, NC
- Chandler, AZ
- Lexington-Fayette, KY
- Wichita, KS
- Santa Ana, CA
- Jacksonville, FL
- Gilbert, AZ
- Baton Rouge, LA
- Fresno, CA
- Tulsa, OK
- Memphis, TN
- Cleveland, OH
- Riverside, CA
- Kansas City, MO
- Lubbock, TX
- Hialeah, FL
- Corpus Christi, TX
- Mesa, AZ
- St. Petersburg, FL
- Oakland, CA
- Plano, TX
- Laredo, TX
- Arlington, TX
- Albuquerque, NM
- Lincoln, NE
- Fort Wayne, IN
- San Jose, CA
- Chesapeake, VA
- Norfolk, VA
- Bakersfield, CA
- Toledo, OH
- Jersey City, NJ
- Winston-Salem, NC
- Aurora, CO
- Glendale, AZ
- Chula Vista, CA
- Irving, TX
- Stockton, CA
- Newark, NJ
- San Bernardino, CA
- North Las Vegas, NV
- Anchorage, AK
- Fremont, CA
- Garland, TX
Featured photo by Jonathan Petersson on Pexels
Dec
Most Expensive Cities for Commuting in the USA
Jason C. 0 comments Dallas, Data Visualization, Maps, Moving News, Seattle
What’s your daily commute like? If you live in or near a major city, traffic is probably a fact of life. Back in August, we shared how much time people of major cities waste over the course of their lives by commuting. The data was put together by EducatedDriver.org. Now, they’re back with more information about your commute; however, this time, they share how much money you spend on gas and vehicle maintenance.
Recall that the average American spends about 408 days commuting. That’s over an entire year of their life driving! In addition to spending time, people also spend money as they drive. Alex Lauderdale writes, “We did the math for nearly 100 major US cities, and found the average American will spend $108,727 on gas and vehicle maintenance costs associated with commuting while driving 173,203 miles to and from work in their lifetime. That’s enough miles to drive around the world 7 times!”
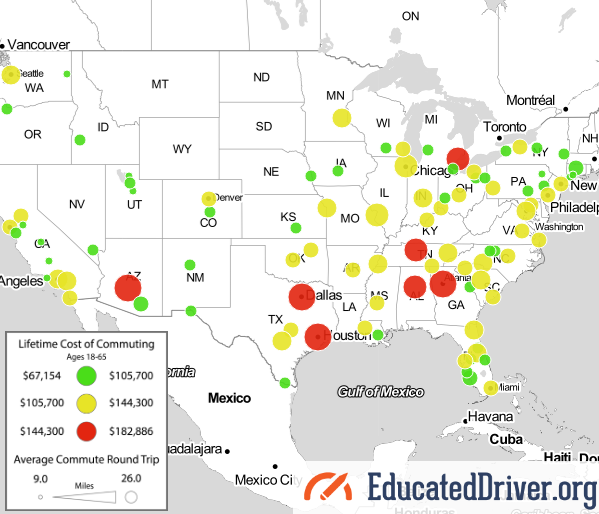
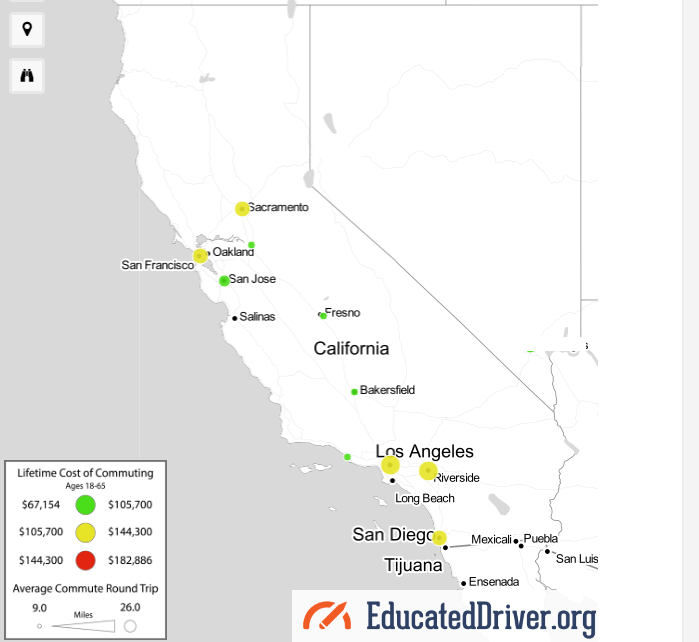
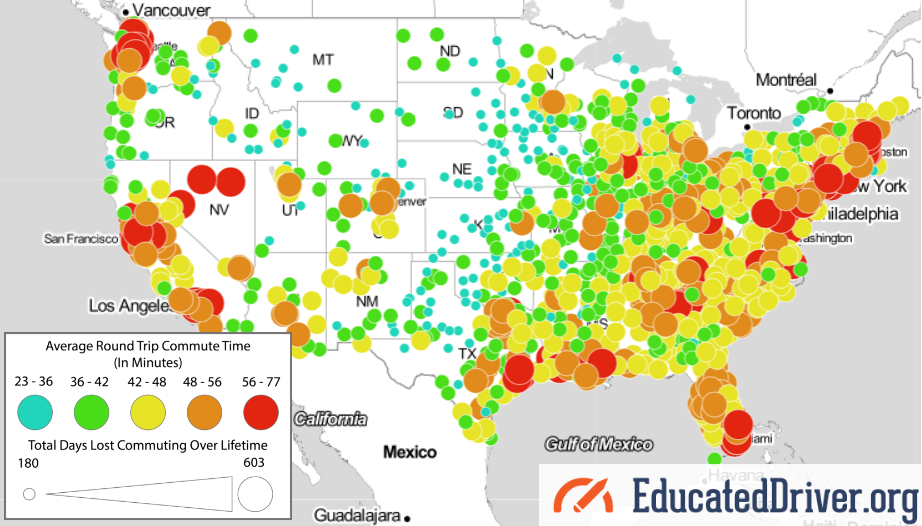
Lifetime Cost of Commuting Map

A quick glance at the map above shows this: red, yellow, and green circles. The circles represent the lifetime cost of commuting in a certain city. The red circles indicate the most expensive cities, the yellow circles indicate more of the average-costing cities, and the green circles indicate cities that are least expensive for commuting.
The lifetime cost of commuting is most in Atlanta. The average round-trip there is 26 miles and the average cost of commuting there is a whopping $182,886. Let’s take a look at some other areas.
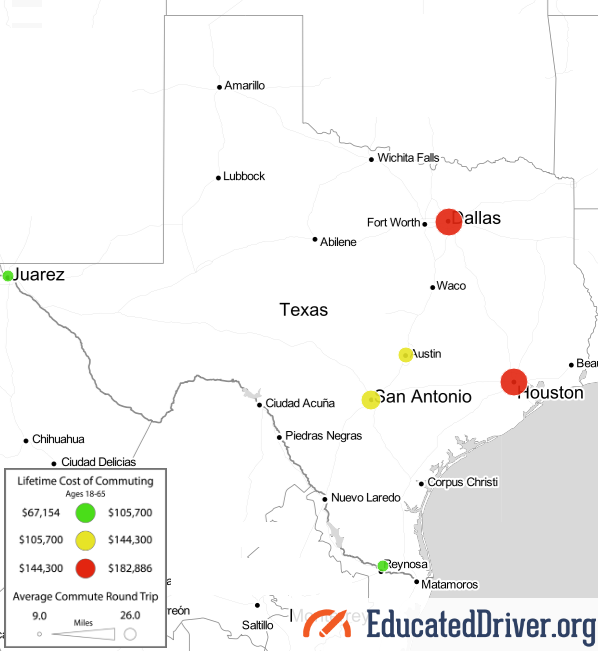
Texas has six cities on the map: Dallas, Houston, San Antonio, Austin, El Paso, and McAllen. Texas is the only state that has two large red circles which cover Dallas and Houston. Check out a photo of Texas below.
California is the state with the most cities on the map. The ten circles cover the following cities: Sacramento, Stockton, San Francisco, San Jose, Fresno, Bakersfield, Oxnard, Los Angeles, Riverside, and San Diego. We often hear about how bad the traffic can be in Los Angles; however, the city has a yellow circle. As a matter of fact, California has no red circles at all. See the photo of the state below.
Top 30 Expensive Cities for Commuting
Where are the most expensive cities for commuting? You have to click each circle to determine exactly how expensive the city is for commuting. To make better sense the map, we turned a large part of the data into a list.
Below, you’ll find the top 30 most expensive cities for commuting. As stated earlier, Atlanta is the most expensive, followed closely by Dallas, Houston, and Phoenix. Check it out as the list goes from most expensive to least:
- Atlanta, GA – $182,886
- Dallas, TX – $174,314
- Houston, TX – $174,314
- Phoenix, AZ – $162,883
- Nashville, TN – $157,168
- Detroit, MI – $148,595
- Birmingham, AL – $144,309
- Chicago, IL – $142,880
- St. Louis, MO – $142,880
- Charlotte, NC – $138,594
- Minneapolis, MN – $135,736
- Indianapolis, IL – $131,450
- Orlando, FL – $130,021
- Knoxville, TX – $130,021
- Washington, DC – $130,021
- Jacksonville, FL – $130,021
- Riverside, CA – $130,021
- Seattle, WA – $128,592
- Columbia, SC – $128,592
- Kansas City, MO – $127,163
- Memphis, TN – $127,163
- San Antonio, TX – $125,734
- Los Angeles, CA – $125,734
- Jackson, MS – $124,306
- Richmond, VA – $124,306
- Cincinnati, OH – $124,306
- Austin, TX – $122,877
- Baltimore, MD – $122,877
- Columbus, OH – $122,877
- Miami, FL – $122,877
The Methodology of the Map
How did EducatedDriver.org come up with the data used to compile the map? Alex Lauderdale writes, “For the purposes of this study, we assumed the average person starts full-time work at 18 (some people start earlier, others a bit later). We also know the average retirement age is 63 in the United States. That works out to a total of 45 years working a full-time job.”
This tells us that the data isn’t precise; however, it’s essentially as estimate based upon common knowledge such as the average retirement age and total years the average person works.
Alex continues, “From there, we operated based on the assumption most people work about 250 days per year, accounting for 2 weeks yearly vacation and time off. That adds up to a whopping 11,250 days of working/commuting over a career.”
Again, we’re seeing best estimates based upon data averages. Not everyone has exactly 2 weeks of vacation each year. Some people have more vacation than that and not everyone uses all of their vacation days.
Finally, Alex pulled data about the average round trip distances as well as how much it costs per mile to drive a vehicle. He writes, “we used data from the US Census Bureau on average daily round trip commute distances as well as data from AAA on the total cost per mile of operating a vehicle (60.8 cents per mile for the average sedan when gas, insurance, and maintenance costs are considered).”
How does your city commute compare with the rest of the country? Do you live near a red, yellow, or green circle? We’re interested in your experience and want to know if it lines up with the data! Use the comments area below to share your story.
Map photos are screenshots by RPS Relocation
Dec
The World Series, Super Bowl, and Stanley Cup are among the pinnacles of sports. These championship events give way to heightened emotion, excitement, and, ultimately, victory or defeat plunging cities into mourning, jubilation, and sometimes anarchy-esque chaos. The larger cities across the country normally have a healthy amount of sports teams and fans that eagerly pursue winning one of these crowns. Others, not so much. Which U.S. cities are the best for sports? In an attempt to answer this, Wallet Hub put together 2018’s best cities for sports.
Adam McCann of WalletHub explains the methodology in picking the best cities. In a nutshell, he writes, “each sports category was assigned a weight corresponding with the total percentage of adults in the U.S. who claim to follow that particular sport, according to The Global Sports Media Consumption Report”.
The sports we are going to highlight are football, basketball, baseball, hockey, and soccer.
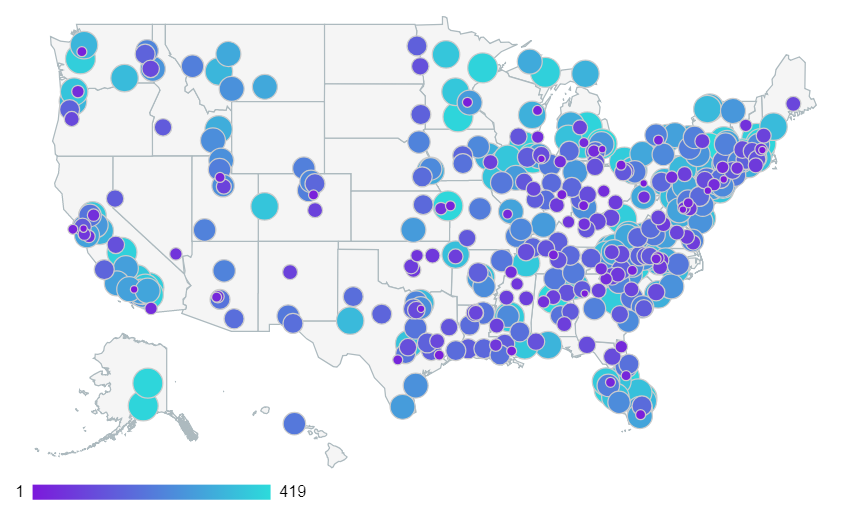
Mapping the Best Cities for Sports
Wallet Hub ran the data to create a visualization of what their findings look like on a map. As you can see, circles — some larger than others — dot the landscape. The larger circles indicate best sports cities that overall rank lower on the list. The smaller circles, like Boston, Chicago, and Los Angeles, indicate cities that are the best of the best when it comes to sports cities.
At a quick glance, it looks like the best cities listed are more or less in tune with the general population size. For example, circles are found up and down the east coast stretching all the way to the Midwest. After that, there are cities few and far between until arriving on the west coast. On the east coast, California has the most of these best cities for sports.
The Best Cities for Football

The Philadelphia Eagles won 2018’s Super Bowl and the city ranks 8th on the list of best cities for football. The Green Bay Packers, a legendary team that is owned by the fans in a city of just over 100,000 people, have the top spot. The #2 slot goes to the Steel City where the Pittsburgh Steelers and their fan are always revved up for game day. Dallas takes the #3 spot even though the professional NFL team that has their name is actually about 20.5 miles away in Arlington, TX. The Cowboys and their fans call themselves “America’s Team” which may have been more true in the 90’s than it is today where “Most of Texas’ team” is likely more fitting. Still the city of Dallas’ mood often fits with how well the Cowboys played the week before and much of the area pays close attention to every decision the team makes. The New England Patriots out of Boston, MA sit just outside of the top 3 spots at #4. The team has competed in the Super Bowl eight times in the last twenty years, out of those appearances they have won five NFL championships.
Here are the top 30 best cities for football:
- Green Bay, WI
- Pittsburgh, PA
- Dallas, TX
- Boston, MA
- New York, NY
- Los Angeles, CA
- Glendale, AZ
- Philadelphia, PA
- Oakland, CA
- Cincinnati, OH
- Atlanta, GA
- Seattle, WA
- New Orleans, LA
- Washington, DC
- Indianapolis, IN
- Miami, FL
- Kansas City, MO
- Minneapolis, MN
- Charlotte, NC
- Nashville, TN
- Buffalo, NY
- Cleveland, OH
- Baltimore, MD
- San Francisco, CA
- Detroit, MI
- Tampa, FL
- Chicago, IL
- Denver, CO
- Houston, TX
- Jacksonville, FL
The Best Cities for Basketball

The #1 Los Angeles Lakers were to the 2000s what the Chicago Bulls were to the 1990s. Coach Phil Jackson and players Shaquille O’Neal and Kobe Bryant propelled the Lakers to three straight championship wins. The Lakers won five championships from 2000-2010. #2 Boston Celtics saw legendary basketball champion Larry Bird play for the team; however, the Celtics were good even before he joined. The Celtics won the NBA Finals an amazing 8 times in a row from 1959-1966. The #3 Golden State Warriors (Oakland, CA) are the hottest team in basketball right now. They won 2018’s NBA Finals. The Warriors also won in 2015 and 2017. Steve Curry is to the Warriors what Michael Jordan was to the Chicago Bulls.
Here are the top 30 best cities for basketball:
- Los Angeles, CA
- Boston, MA
- Oakland, CA
- San Antonio, TX
- Salt Lake City, UT
- Miami, FL
- Oklahoma City, OK
- Chicago, IL
- Cleveland, OH
- Philadelphia, PA
- New York, NY
- Washington, DC
- Dallas, TX
- Houston, TX
- Atlanta, GA
- Indianapolis, IN
- Orlando, FL
- Portland, OR
- New Orleans, LA
- Sacramento, CA
- Milwaukee, WI
- Detroit, MI
- Chapel Hill, NC
- Lawrence, KS
- Memphis, TN
- Minneapolis, MN
- Durham, NC
- Charlotte, NC
- Denver, CO
- Lexington, KY
The Best Cities for Baseball

The Boston Red Sox won 2018’s World Series and ranks at number 8 in the best cities for baseball. The Red Sox have competed in the championship game twice in the past 10 years. They won both times. Their rivals are the New York Yankees. #1 New York is home to the Yankees and Mets. #2 Los Angeles is home to the Angels and they’ve only had one World Series win (2002). The team became more popular after the 1994 movie “Angeles in the Outfield”. The #3 St. Louis Cardinals have won numerous championship games; however, the lost in 2003 to the current champs (Boston Red Sox).
Here are the top 30 best cities for baseball:
- New York, NY
- Los Angeles, CA
- St. Louis, MO
- Atlanta, GA
- Chicago, IL
- San Francisco, CA
- Cincinnati, OH
- Boston, MA
- Pittsburgh, PA
- Arlington, TX
- Oakland, CA
- Minneapolis, MN
- Detroit, MI
- St. Petersburg, FL
- Baltimore, MD
- Milwaukee, WI
- Cleveland, OH
- Philadelphia, PA
- San Diego, CA
- Kansas City, MO
- Phoenix, AZ
- Houston, TX
- Denver, CO
- Seattle, WA
- Washington, DC
- Miami, FL
- Buies Creek, NC
- Spokane, WA
- Annapolis, MD
- Durham, NC
The Best Cities for Hockey

The Washington Capitals won 2018’s Stanley Cup and the city ranks at number 10 in the best cities for hockey. The Chicago Blackhawks are notable because they won the championship game three times in the last ten years. The #1 Boston Bruins have played in the Stanley Cup 19 times and won 6 of them. The #2 Detroit Red Wings, however, won even more championship games. The Red Wings have played in the Stanley Cup 24 times and won 11 of them. Finally, the #3 Pittsburgh Penguins have played in the finals only 6 times; however, the Penguins won 5 out of 6 of those games. That gives the Penguins a better win percentage over the Bruins and Red Wings.
Here are the top 30 best cities for hockey:
- Boston, MA
- Detroit, MI
- Pittsburgh, PA
- New York, NY
- Chicago, IL
- Newark, NJ
- St. Louis, MO
- Buffalo, NY
- Anaheim, CA
- Washington, DC
- Philadelphia, PA
- San Jose, CA
- St. Paul, MN
- Denver, CO
- Sunrise, FL
- Tampa, FL
- Los Angeles, CA
- Las Vegas, NV
- Dallas, TX
- Glendale, AZ
- Nashville, TN
- Raleigh, NC
- Columbus, OH
- Ann Arbor, MI
- Durham, NH
- Grand Forks, ND
- Lewiston, NY
- Hamilton, NY
- Hanover, NH
- Orono, ME
The Best Cities for Soccer

Toronto FC is 2018’s MLS Cup winner. While a North America Soccer team, Toronto is not applicable to the best cities map because it only covers the United States. The top spot for soccer is held by Los Angeles whose team, LA Galaxy, has won the MLS Cup three times in the last ten years. #1 LA Galaxy is popular in part due to having international soccer star David Beckham as a former player. He helps the Galaxy win two straight MLS Cups (2011 and 2012). The #2 Orlando City Lions only became a team 5 years ago, in 2013. The demographic and local support for soccer lead to the creation of the team. Finally, the #3 Seattle Sounders is also a relatively new team. The Sounders were formed 11 years ago, in 2007, for the same reasons as the creation of the Orlando Lions. Soccer is becoming more popular in the U.S.!
Here are the top 30 best cities for soccer:
- Los Angeles, CA
- Orlando, FL
- Seattle, WA
- Portland, OR
- New York, NY
- Salt Lake City, UT
- Washington, DC
- Kansas City, MO
- Atlanta, GA
- Chicago, IL
- Houston, TX
- Columbus, OH
- Cary, NC
- Minneapolis, MN
- Boston, MA
- Dallas, TX
- San Jose, CA
- Denver, CO
- Philadelphia, PA
- Piscataway, NJ
- Cincinnati, OH
- Louisville, KY
- Sacramento, CA
- Charleston, SC
- Miami, FL
- Richmond, VA
- St. Louis, MO
- Bethlehem, PA
- San Antonio, TX
- Tulsa, OK
Dallas, Seattle, Las Vegas, Kansas City, and Chicago
If you’be been following our blog, you know that these cities are great places to live for various reasons. Where do they stand as the best cities for sports? Check them out below.
- Dallas—Football: 3; Basketball: 13; Baseball: 177; Hockey: 19; Soccer: 16
- Seattle—Football: 12; Basketball: 83; Baseball: 24; Hockey: 450; Soccer: 3
- Las Vegas—Football: 197; Basketball: 198; Baseball: 89; Hockey: 18; Soccer: 43
- Kansas City—Football: 450; Basketball: 450; Baseball: 450; Hockey: 450; Soccer: 45
- Chicago—Football: 27; Basketball: 8; Baseball: 5; Hockey: 5; Soccer: 10
Featured photo is a screenshot of Wallet Hub sports map by RPS Relocation
All sports photos by CC0 Creative Commons on Pixabay
Map of best sports cities is embedded from WalletHub

Oct
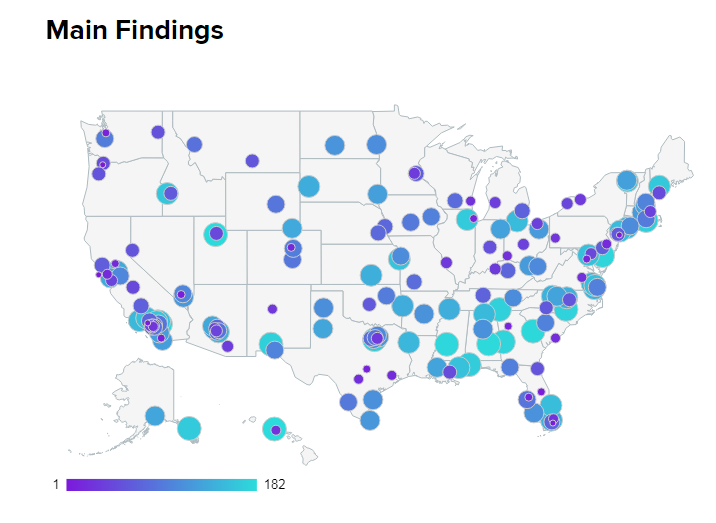
Some cities are better than others when it comes to food. More specifically, some cities are better for “foodies”. Foodies are those who explore new flavors and learn about different types of foods. WalletHub put together a comprehensive list of the best cities in America for foodies. They ranked the top 182 cities, to include the 150 most populous. Let’s explore some of these cities more in detail.
The Top 25 Cities
Topping the list is Portland, Oregon. Portland is well known as a “hipster haven” whose residents reach for the authentic. That includes food. Voodoo Donuts, Moonstruck Chocolates, Salt & Straw Ice Cream—theses are some of the food establishments Portland is known for.
The top 35 cities are as follows:
- Portland, OR
- San Francisco, CA
- Miami, FL
- New York, NY
- Los Angeles, CA
- Orlando, FL
- Las Vegas, NV
- Seattle, WA
- San Diego, CA
- Austin, TX
- Atlanta, GA
- Tampa, FL
- Chicago, IL
- Denver, CO
- Washington, DC
- Sacramento, CA
- Philadelphia, PA
- Houston, TX
- Oakland, CA
- Charleston, SC
- San Antonio, TX
- Cincinnati, OH
- Richmond, VA
- Milwaukee, WI
- Fort Lauderdale, FL
- Honolulu, HI
- Pittsburgh, PA
- Santa Ana, CA
- Albuquerque, NM
- St. Louis, MO
- Dallas, TX
- Rochester, NY
- Louisville, KY
- Minneapolis, MN
- Tucson, AZ
California and Texas: The States for Foodies
Of the 182 best cities for foodies, Califonia has 29 of them and Texas has 16. Granted, those two states are the two largest in the country, population wise. California is known for In-N-Out and avocado toast while Texas is known for Texas BBQ, Tex-Mex, chicken fried steak, and Texas chili. These famous food options are extremely simplified and one can find all types of lesser-known delights in these states and others.
While some Texans won’t be surprised at how well Austin and Houston ranked, they might be confused by Dallas ranking #31 on the list well after San Antonio and even lower than Albuquerque, NM. Ouch.
How These Cities Were Chosen
Adam McCann writes, “In order to determine the best and cheapest local foodie scenes, WalletHub compared 182 cities — including the 150 most populated U.S. cities, plus at least two of the most populated cities in each state — across two key dimensions, “Affordability” and “Diversity, Accessibility & Quality.”
Having these dimensions is important for a few reasons. With affordability, it was important for WalletHub that the food be accessible to the general population. For example, not everyone can afford a $100 meal, even if the taste is out of this world. Affordability doesn’t negate the lack of quality; instead, having affordable, quality food strikes a balance. The diversity of food within a city touches on the exploratory aspect of a city being known as a foodie haven.
Other Considerations
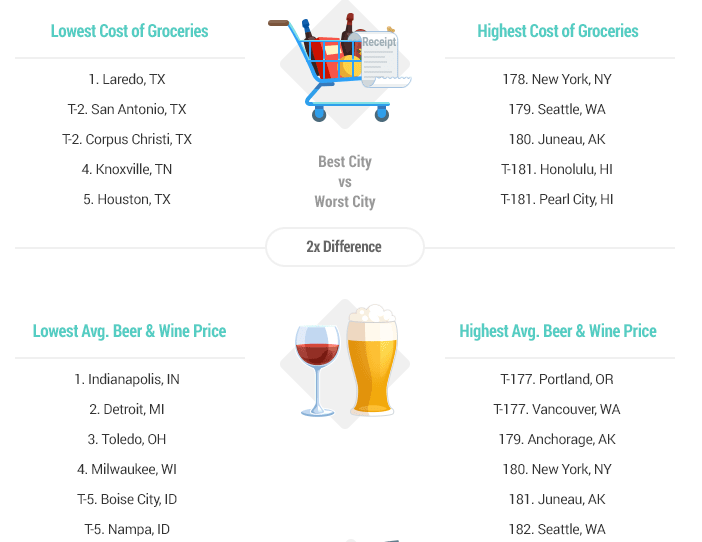
Cost of groceries, average alcohol prices, restaurants per capita, and coffee shops per capita are among additional factors that were taken into consideration.
Texas has 4 of the top 5 cities—Laredo, San Antonio, Corpus Christi, and Houston—for the lowest priced groceries. The other city is Knoxville, TN. For the highest-priced groceries, the cities from the list consist of New York, NY, Seattle, WA, Juneau, AK, Honolulu, HI, and Pearl City, HI.
Alcohol is cheapest in Indianapolis, IN, Detroit, MI, Toledo, OH, Milwaukee, WI, Boise City, ID, and Nampa, ID. It’s most expensive in Portland, OR, Vancouver, WA, Anchorage, AK, New York, NY, Juneau, AK, and Seattle, WA.
What’s striking here is that while Portland is number one on the list, alcohol is the most expensive in the city. Portland also has the highest number of breweries per capita which is something WalletHub also took into consideration.
Featured photo by Chan Walrus on Pexels
Map photo and best groceries photos are screenshots by RPS Relocation

Oct
Allergies—a health condition whereby the immune system is negatively impacted by foreign particles or substances—are a public nuisance. These substances can be found in cities across the nation; however, some places have a significantly higher amount than others.
The Asthma and Allergy Foundation of America (AAFA) conducted a comprehensive study to identify where allergies are the worst during the Fall season. The actually listed 100 cities, which you’ll see at the end of this article.
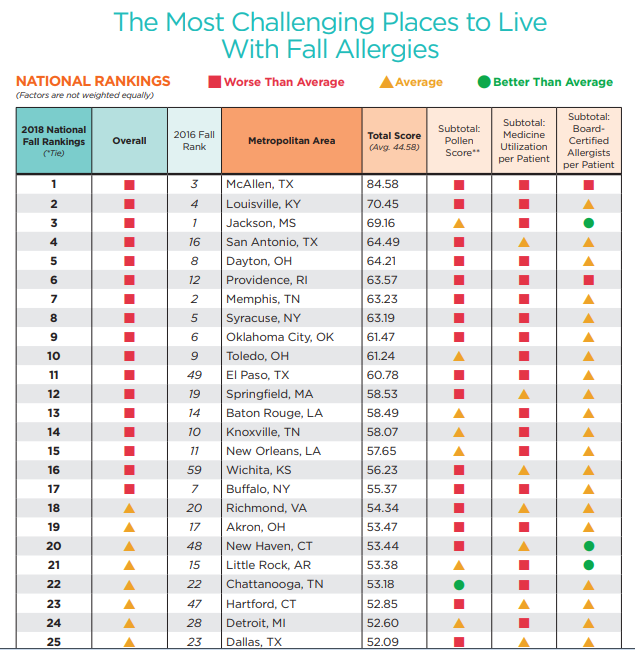
AAFA’s Criteria for Inclusion
How did the AAFA determine which cities made the cut, and which didn’t? They describe it in detail: “The ranking is based on analysis of data from the 100 most-populated Metropolitan Statistical Areas (MSAs) in the contiguous 48 states. The three (3) individual factors analyzed for the 2018 rankings are: seasonal (Fall) pollen score, medication use (allergy) and number of allergy specialists. For each factor, AAFA used the most recently available calendar year data. Weights are applied to each factor; factors are not weighted equally. Total scores are calculated as a composite of all three factors.”
Tips for Allergy Prevention
The AAFA provides actionable tips which will help you avoid or reduce your allergies. The recommend wearing sunglasses outdoors, removing shoes in the home, and keeping windows closed. If you have carpeting, regular vacuuming will reduce allergens in your home. Bed sheets should also be cleaned on a regular basis.
The AAFA also recommends “CERTIFIED asthma & allergy friendly” products such as cleaning supplies. You can also find allergy-friendly bed mattresses and HVAC filters. The more allergy friendly products you own, the better chance you have at mitigating the presence of allergies in your home.
The Top 100 Cities with Fall Allergies
The cities below are ranked from worst to best as the “most challenging places to live with fall allergies”.
- McAllen, TX
- Louisville, KY
- Jackson, MS
- San Antonio, TX
- Dayton, OH
- Providence, RI
- Memphis, TN
- Syracuse, NY
- Oklahoma City, OK
- Toledo, OH
- El Paso, TX
- Springfield, MA
- Baton Rouge, LA
- Knoxville, TN
- New Orleans, LA
- Wichita, KS
- Buffalo, NY
- Richmond, VA
- Akron, OH
- New Haven, CT
- Little Rock, AR
- Chattanooga, TN
- Hartford, CT
- Detroit, MI
- Dallas, TX
- Birmingham, AL
- Philadelphia, PA
- Columbia, SC
- Columbus, OH
- Tulsa, OK
- Greenville, SC
- Albany, NY
- Grand Rapids, MI
- 21 Cleveland, OH
- Pittsburgh, PA
- Charleston, SC
- New York, NY
- Scranton, PA
- Miami, FL
- St. Louis, MO
- Bridgeport, CT
- Austin, TX
- Allentown, PA
- Las Vegas, NV
- Omaha, NE
- Greensboro, NC
- Winston-Salem, NC
- Augusta, GA
- Virginia Beach, VA
- Cape Coral, FL
- Houston, TX
- Jacksonville, FL
- Fresno, CA
- Tucson, AZ
- Madison, WI
- Cincinnati, OH
- Nashville, TN
- Chicago, IL
- Rochester, NY
- Riverside, CA
- Charlotte, NC
- Indianapolis, IN
- Orlando, FL
- Des Moines, IA
- Los Angeles, CA
- Modesto, CA
- Lakeland, FL
- Minneapolis, MN
- Harrisburg, PA
- Kansas City, MO
- Albuquerque, NM
- Tampa, FL
- Durham, NC
- Worcester, MA
- Oxnard, CA
- Atlanta, GA
- Milwaukee, WI
- Baltimore, MD
- Bakersfield, CA
- Phoenix, AZ
- Boston, MA
- Palm Bay, FL
- Washington, DC
- San Diego, CA
- Spokane, WA
- Stockton, CA
- Daytona Beach, FL
- Sarasota, FL
- Raleigh, NC
- Sacramento, CA
- Salt Lake City, UT
- San Francisco, CA
- Ogden, UT
- Colorado Springs, CO
- Seattle, WA
- San Jose, CA
- Boise, ID
- Portland, OR
- Provo, UT
- Denver, CO
Featured image by Public Domain Pictures on Pexels
AAFA city allergies chart photo is a screenshot by RPS Relocation

Sep
One of the reasons people relocate is to chase an opportunity. Another reason is for them is to enjoy a heightened quality of life. The better quality of life may include lower crime, increased affordability, or a larger number of amenities offered by the city or local organization. MONEY, a division of Time Magazine, put together a list of the 50 greatest places to live in America. Here are their top ten picks:
- Frisco, Texas
- Ashburn, Virginia
- Carmel, Indiana
- Ellicott City, Maryland
- Cary, North Carolina
- Franklin, Tennessee
- Dublin, California
- Highlands Ranch, Colorado
- Sammamish, Washington
- Woodbury, Minnesota
Criteria to Make the List
The list—which features cities from all over the country—is governed by nine categories. They are:
- Economy
- Cost of Living
- Diversity
- Education
- Income
- Housing
- Crime
- Amenities
- Ease of Living
Having this many categories allowed MONEY to conduct a comprehensive analysis in support of their findings. In addition, they write “we looked only at places with populations of 50,000 or greater. We eliminated any place that had more than double the national crime risk, less than 85% of its state’s median household income, or a lack of ethnic diversity. This gave us 583 places.” Narrowing the criteria by these small factors meant that only 8.5% of cities would be chosen.
With regards to home prices, MONEY needed to find a partner with access to a database of nation-wide prices. So they teamed up with Realtor.com. Realtor.com—an online real estate broker—was the perfect answer to MONEY’s problem. The real estate broker was able to grant access to home prices in virtually every city across the country.
There are two places I’d like to focus on due to their close proximity to the cities we serve. Frisco, TX is near Dallas and Sammamish, WA is near Seattle. Let’s start with Frisco.
The Greatest Place: Frisco, TX

There’s another bonus to talking about Frisco, TX: It ranks number one on the list! Frisco excels in every category of criteria. MONEY writes Frisco is “a sleepy bedroom community of 6,500 people as recently as 1990, the city today houses around 180,000 residents. Jobs are projected to grow by nearly 15% over the next four years, according to Moody’s Analytics, and companies from T-Mobile to Oracle have offices in the city.” Here’s what this means: People are flocking to Frisco and there’s no indication its popularity will wane anytime soon.
Frisco is also a great place for growing families. Indeed, public schools in the city have “the highest graduation rate of all the cities and towns MONEY evaluated this year.”
A Tech and Outdoors Haven: Sammamish, WA
Sammamish also ranks very highly on the list, coming in at number nine. When people think about tech companies, they think “Silicon Valley” which is located in California; however, Sammamish “attracts many of the people who work for Microsoft, Amazon, Expedia and other tech giants.” Like Silicon Valley, the home prices are relatively expensive. But here’s the good news: salaries are relatively high as well.
Culture and recreational living flourish in Sammamish. The city has fourteen parks and nature preserves which are populated by diverse wildlife. Sammamish is also home to regular concerts and exhibitions.
Take a look at other places on the list. If you’re interested in relocation anywhere, make sure you use our form to get a free moving quote.
Featured image by Pixabay on Pexels
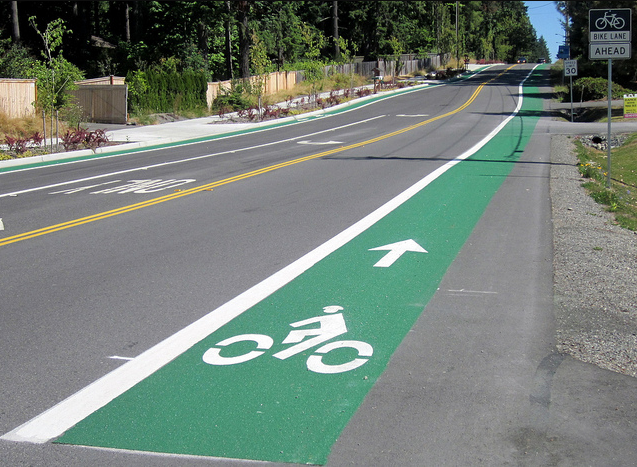
Farmers market and bike lane photos are screenshots by RPS Relocation
Aug
How Much Time Residents Of Major USA Cities Waste Commuting In Their Lifetime
Jason C. 0 comments Dallas, Data Visualization, Maps, Seattle
How much time do you spend driving? If you live in or near a major city, the answer is probably “a lot”. EducatedDriver.org has put together a data visualization map which details the average round trip commute time that may affect you.
Alex Lauderdale, the author of the article, writes “We did the math for nearly 1,000 US cities. The average American loses 408 days of their life commuting, and in many areas, the toll is even higher.” Let’s dig a little deeper and look at some individual cities listed.
Here’s How Much Time You’ll Waste Commuting in Your Lifetime (by City)
The Cities We Serve
Here at RPS Relocation, we focus on offering a great relocation experience in Dallas, Seattle, Las Vegas, and Boulder; so we’ll use them as examples. What is the average commute time like in each of these cities? We’ve sorted them from worst to best, starting with Seattle which is the worst on this map.
Seattle, WA — Seattle has one of the worst average round trip commute times in the country. If you look closely at the visualization, the city is marked by a red circle which stands for the longest commutes. Indeed, a commuter in Seattle will spend 463 days of their life on the road. The average round trip commute time is 59.2 minutes.
Dallas, TX — Dallas is orange on the map, which is one step better. A commuter in the city will lose 436 days of their life by driving in or around it. The average round trip commute time in Dallas is 55.8 minutes. Dallas must have just missed being in the red due to its close proximity to the commuting times Seattle drivers have to deal with.
Las Vegas, NV — Las Vegas, like Dallas, is also in the “orange zone”. A commuter in Sin City will spend 381 days of their life on the road. The average round trip commute time in Las Vegas is 48.8 minutes.
Boulder, CO — Out of the four cities, drivers in Boulder have it the best. The city is right in the middle when it comes to average commute times. The area is marked by a yellow circle. A driver in Boulder will lose 350 days of their life to commuting. That’s just under one year! The average round trip commute time in Boulder, CO is 44.8 minutes.
Other Major or Growing Cities
Major cities in red on the visualization map seem to be the largest in the country. Many of the ones in yellow seem to be growing or up-and-coming cities. Austin, Charlotte, and Denver come to mind. For the remainder, take a glance at where these cities stand with regards to the average round trip commute time. The number after each city is the round trip time in minutes.
Red Circle
New York 71.8
Washington D.C. 68.8
Chicago 64.4
San Francisco 64.2
Boston 64
Philadelphia 63
Miami 61.2
Los Angeles 60.8
Houston 59
Orange Circle
San Jose 54.6
Denver 54.6
Nashville 54
Detroit 53.4
Austin 52.8
Jacksonville 52.6
Charlotte 52.6
Portland 52.4
Phoenix 52
San Antonio 51.4
San Diego 50.6
Yellow Circle
Kansas City 45.8
Oklahoma City 44.8
Featured photo by Pixabay on Pexels
EducatedDriver.org data visualization map photo is a screenshot by RPS Relocation

Jul
Millennial Movers are heading to Washington and Texas in droves
Jason C. 0 comments Dallas, Moving News, Seattle
Birds of a feather fly together. The same can be said of Millennials. That’s because they are flocking to the same cities around the country in large numbers. Now, we have hard data of where they’re moving to, courtesy of SmartAsset. As you know from the title, Millennials are moving to Washington and Texas. Where else are they moving to? Keep reading to find out!
Top Ten States
We listed Washington and Texas specifically because they are the top two states Millennials are moving to. Here’s the full list:
- Washington – 39,590
- Texas – 33,650
- Colorado – 26,547
- Virginia – 18,338
- Georgia – 17,621
- Oregon – 11,989
- North Carolina – 9,647
- Nevada – 8,820
- Florida – 7,195
- Arizona – 7,077
And there you have it. These are the most popular states that Millennials are migrating to. The number to the right of the state indicates net migration.
Why are Millennials moving to those states? And why are they moving away from cities like Chicago and New York? Jobs, housing, and the cost of living are among the biggest reasons. Business is booming in states like Texas and in cities like Dallas/Fort Worth, for example.
Methodology of the Data
Where did the data come from? Derek Miller of SmartAsset writes, “In order to calculate which cities and states millennials are moving to, SmartAsset compared 2016 Census Bureau migration data for 217 cities and all 50 states, plus Washington, D.C. We compared the number of persons between the ages of 20 and 34 who emigrated from each city and state to the number who immigrated. We ranked the cities and states by highest difference between the number who immigrated and the number who emigrated for persons ages 20 to 34.”
And there you have it. The data comes from the Census Bureau which is probably the best place to get it from. The ages of between 20 and 34 are the target ages for Millennials which proves that the data has merit. Furthermore, the use of migration data for 217 cities shows that the study is a comprehensive one.
Unless cities like New York and Chicago take action to attract Millennials, those cities will eventually get smaller if people came moving away from them.
Featured photo by StockSnap on pixabay
May
If you’re looking to make a move so you can be the founder and CEO of your own startup or work at a hot new tech company. Then Seattle, WA might be where you want to go. Moving to Seattle can be a bit of difficult task for some people. To make your move easier check out our list of moving tools and our ultimate moving checklist.
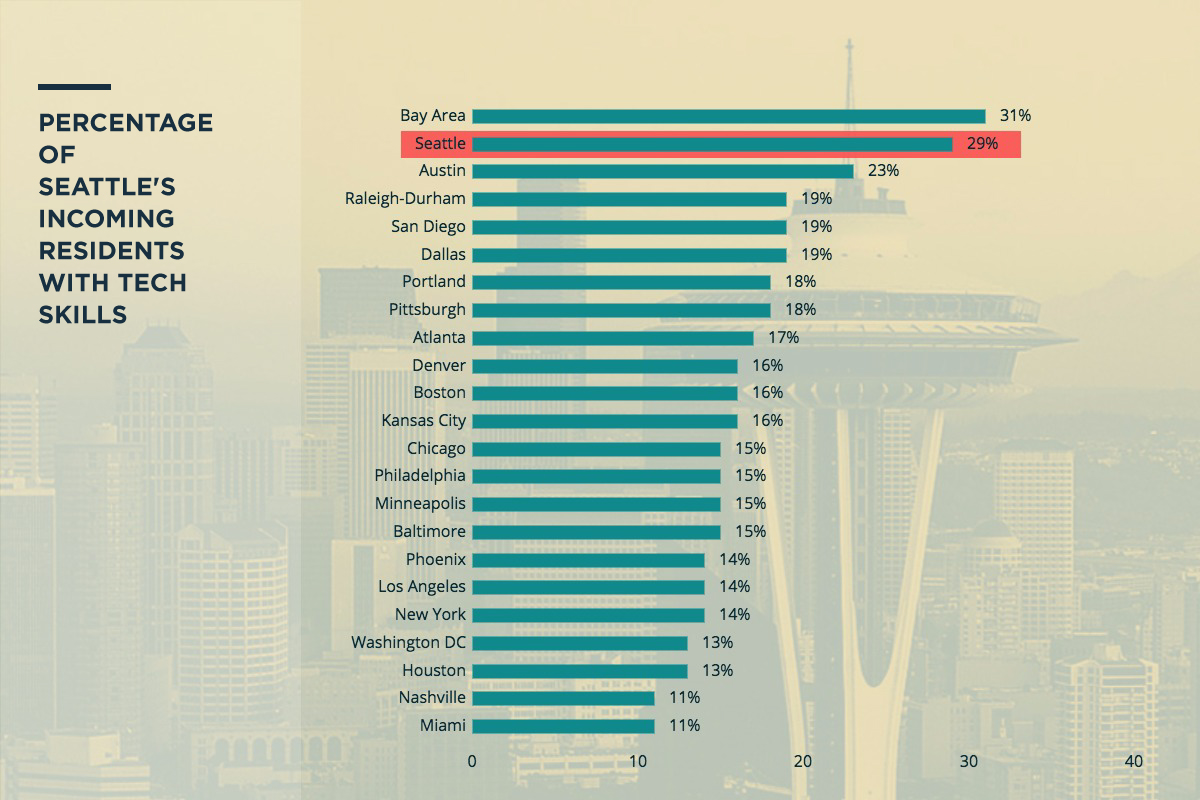
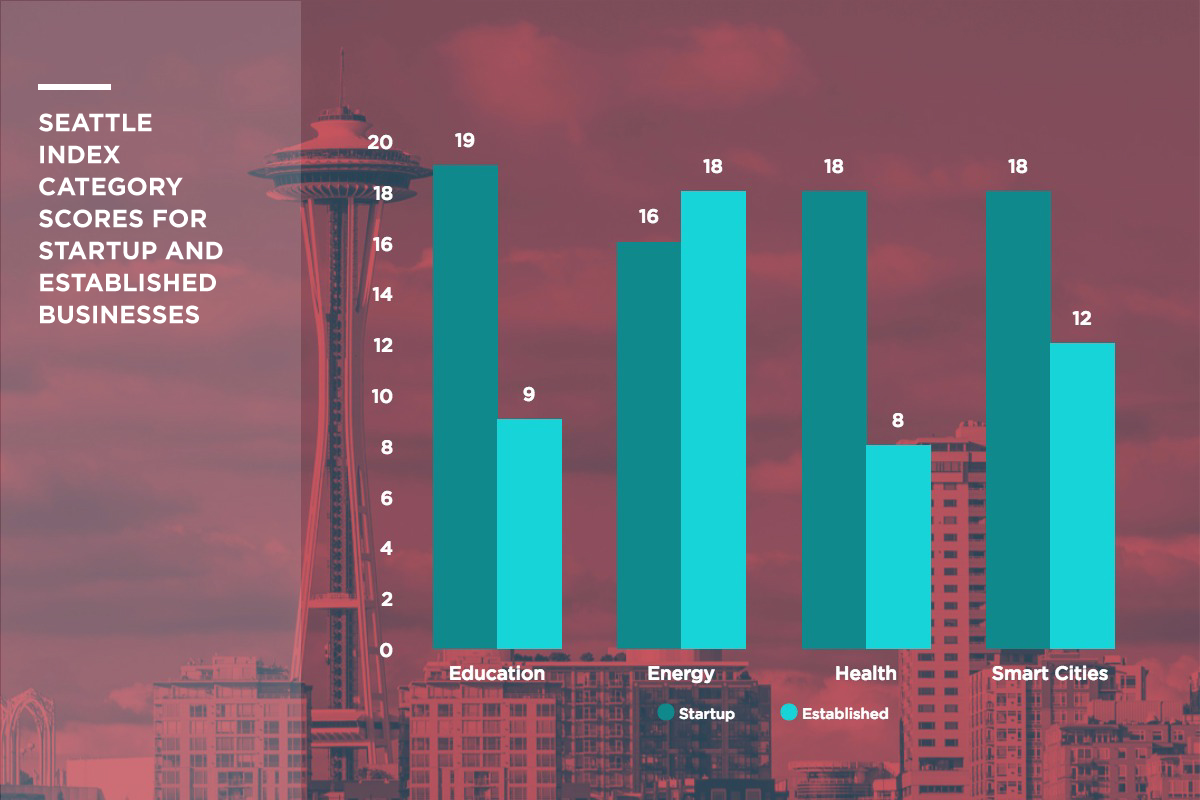
A recent report on American cities and communities ranked Seattle #11 in the top cities for digital innovation. The report, Innovation that Matters, is an annual research publication which seeks to see how cities and communities are working to support the move to a more digitally based economy. The reports authors, venture capital firm 1776, gave out high marks for the number of people moving to Seattle with tech skills and for having relatively even presence in the 4 major tech sectors; Education, Energy, Health, and Smart Cities. Seattle scored highest in the startup-Education sector, established-Energy sector, startup-Health sector, and the startup-Smart Cities sector. The survey concluded that hiring talented digital workers in Seattle would be pretty easy naming it the #2 city for ha skilled work force and the #4 overall top talent pools for startups in the country powered in part by the presence of Amazon and Microsoft in the region and the long-term impact the general I.T. industry has had on the city and it’s economy.
The talent base in Seattle is thriving. The city (home-base for tech titans Amazon and Microsoft) has been vaulted into the upper echelon of U.S. tech hubs. Additionally, the city’s robust population inflows, educated millennials and skilled tech workforce make it a powerhouse when it comes to attracting top talent. – 1776, Innovation that Matters report
However, the researchers also concluded that there were disconnects in the startup industry as to how well the startup scene is spread around the city and metro area. Most digital startups are located in the same part of Seattle, Downtown which makes it feel like a strong dense community to the startups but not to everyone in the city. This is important because startups need more than just their friends next door to support them to be successful, they need more people in local business communities to be involved as well, Seattle ranks #24 in this regard. The city ranks #21 (out of 25 cities/areas) in the number of mentors, #22 in cheerleaders, & #22 in engaged citizens as well.
The tech startup scene in Raleigh-Durham vs. Seattle from 2011-2015
The researchers point to this lack of community engagement and assistance as the top hurdle for the startup community in Seattle moving foward and the biggest reason the area ranks lower than others on the list.
The 10 cities that topped Seattle in the list are:
- Boston
- San Francisco (Bay Area)
- Denver
- Raleigh-Durham
- San Diego
- Austin
- Los Angeles
- Philadelphia
- Washington DC
- New York
Seattle beat out 4 other cities in the list of 25. This includes some that are growing in population and infrastructure quickly such as Dallas, Kansas City, and Houston. The full list of cities topped by Seattle’s tech startup scene are:
- Chicago
- Portland
- Pittsburgh
- Nashville
- Minneapolis
- Salt Lake City
- Baltimore
- Dallas
- Houston
- Atlanta
- Miami
- Phoenix
- Kansas City
- New Orleans
Read the full Innovation that Matters 2016 report from 1776 here: http://www.1776.vc/reports/innovation-that-matters-2016/
Most Recent Blog Posts
 A Dallas Area Home Buyer Had to Pay $300,000 More Than Asking Price For Their New Home22 May, 2021
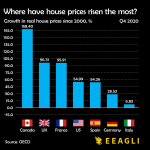
- Canada's Home Prices Have Risen 168.4% Since 2000, USA Home Prices Have Risen 54.99%01 Apr, 2021
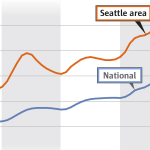
- Home Prices in Seattle Are Skyrocketing12 Mar, 2021
- Seattle Among Best Cities for Startups08 Jul, 2019
- Renters in Chicago and New York are fleeing south for Dallas24 Jun, 2019