Blog

Nov
Dallas Map Startup Shows Critical Data in One Place
Jason C. 0 comments Dallas, Data Visualization, Maps
Knowledge is power! And in our Information Age, data is the new form of knowledge. This data is being used to make humanity better. Technological advances are moving at the speed of Moore’s Law which sees computer power doubling every two years.
Data can be used to improve the lives of people at the federal, state, and local levels. One of the ways to determine where data will encourage positive action is to actually see the data. This can be accomplished by creating a data visualization on a map.
For Dallas, Texas, this such data visualization has become a reality. A substantial number of data sets have been collected with the goal of making the city better. This visualization is called TheMap. D Magazine gives us some background of how the map came to be.
Improving Dallas with a Map
Robert Mundinger, a longtime resident of Dallas, noticed problems in the areas he lived in. Matt Goodman of D Magazine wanted to learn more about TheMap from Mundinger.
Matt writes, TheMap is “an open-source, interactive web portal that allows users to access an array of data sets that can help people better understand all sorts of things about Dallas. The data sets can be used to generate maps. It’s all exportable. “A kid’s educational outcome is dependent on education and crime and health and access to food, access to internet, libraries,” Mundinger says. “All these variables affect each other so much that there needs to be one place where people can look at them together and analyze them.”
What Mundinger wants to achieve in simple: Highlight at-risk areas of the city. In addition, and while he was at it, Mundinger went ahead and included more data set that might be of use.
There are neighborhoods in Dallas which have a high concentration of poverty. This is included in the map visualization. There are intersections that have more fatal pedstrian crashes than others. This is also included in TheMap. There’s even data about where there are working females over the age of 16. The information contained within TheMap is comprehensive!
Let’s take a closer look at the data sets available for viewing.
Data Sets in TheMap
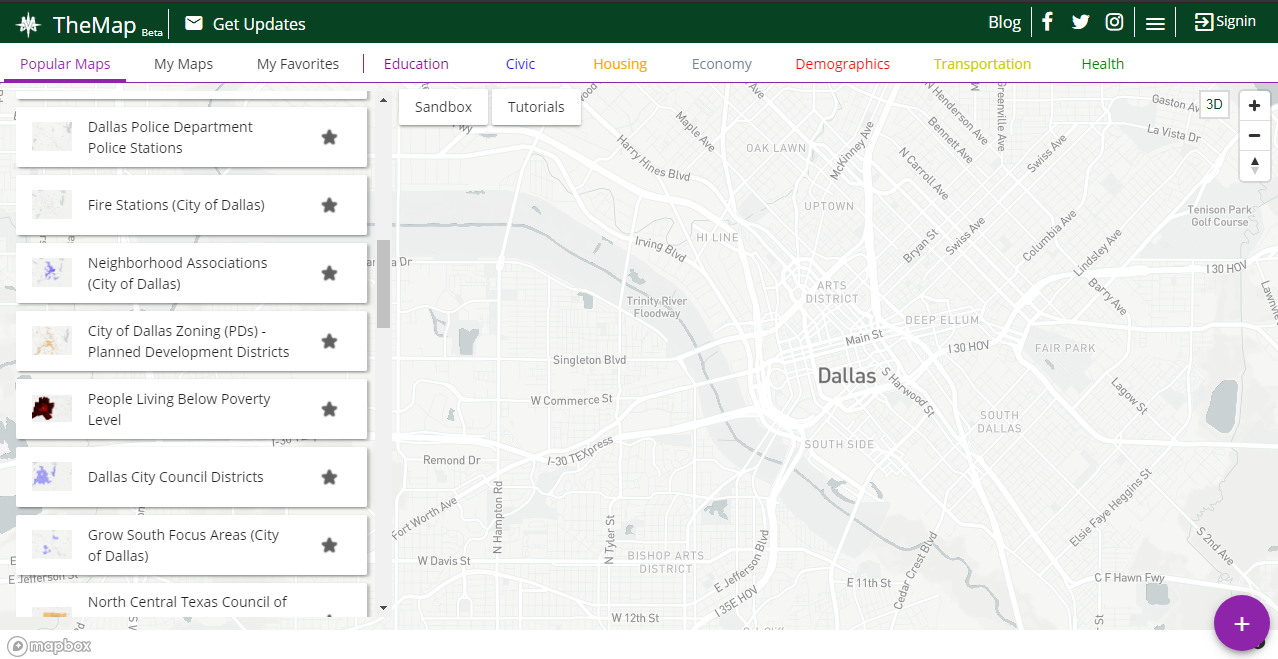
Police stations, fire stations, neighborhood associations, poverty areas—these are some of the data sets that are included in TheMap. Take a look at the column on the left to see them all. TheMap defaults to Popular Maps whe you visit the website.
You can otherwise click on Education, Civic, Housing, or other major types of data sets. Check out the row near the top to see more.
Once you click a data set, the information will be uploaded to the map. Let’s say you click on police departments. Pinpoints of every police department in Dallas will show up on the map. You can click them individually to get the name, address, and more information about the particular police department.
Bus Stops in Dallas
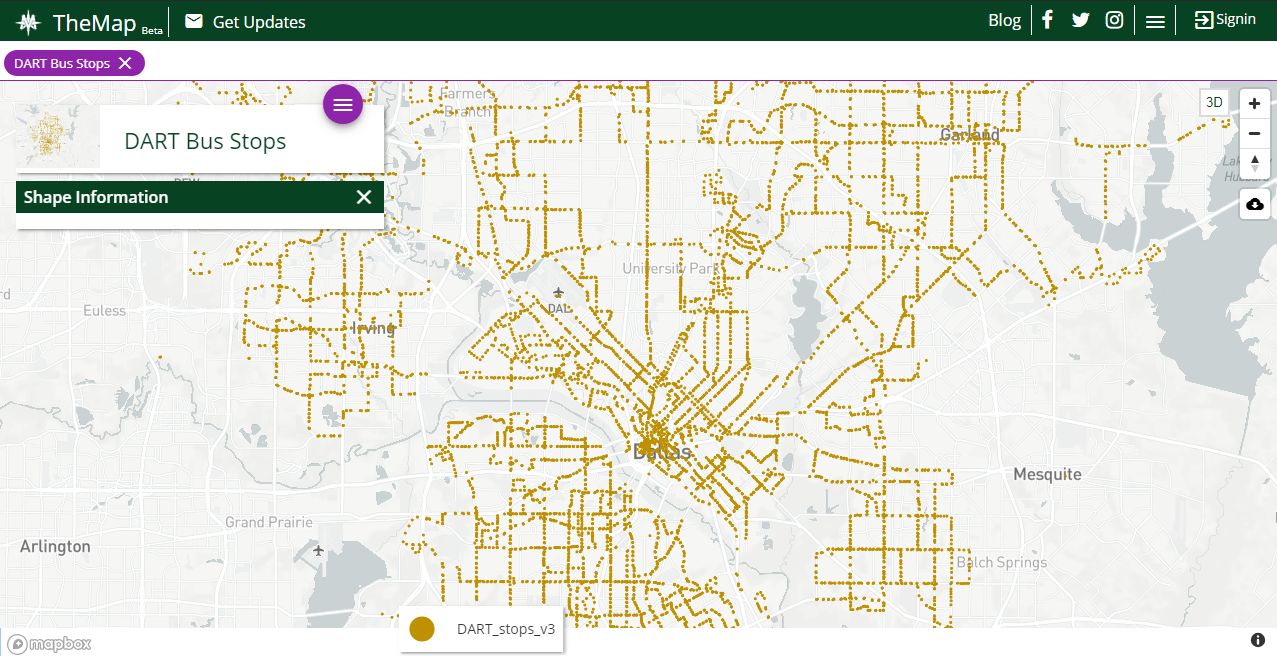
One of my favorite visualizations in TheMap is seeing where DART bus stops are. DART—which stands for Dallas Area Rapid Transit—seemingly has bus stops all over the city. A quick glance shows what can be estimated to over 100 bus stops.
This data set is surely important to Mundinger. After all, he’s concerned with increasing the access of public services to all residents of Dallas, including those below the poverty line. With TheMap, Dallas city officials can combine areas of poverty with bus stop locations. If there’s an area which is lacking of public transportation, DART could add a new bus stop there.
Combining Datasets in TheMap
One of the most powerful and helpful features of TheMap is the ability to combine and layer multiple datasets. To do this, you’ll need to create an account which only takes a minute.
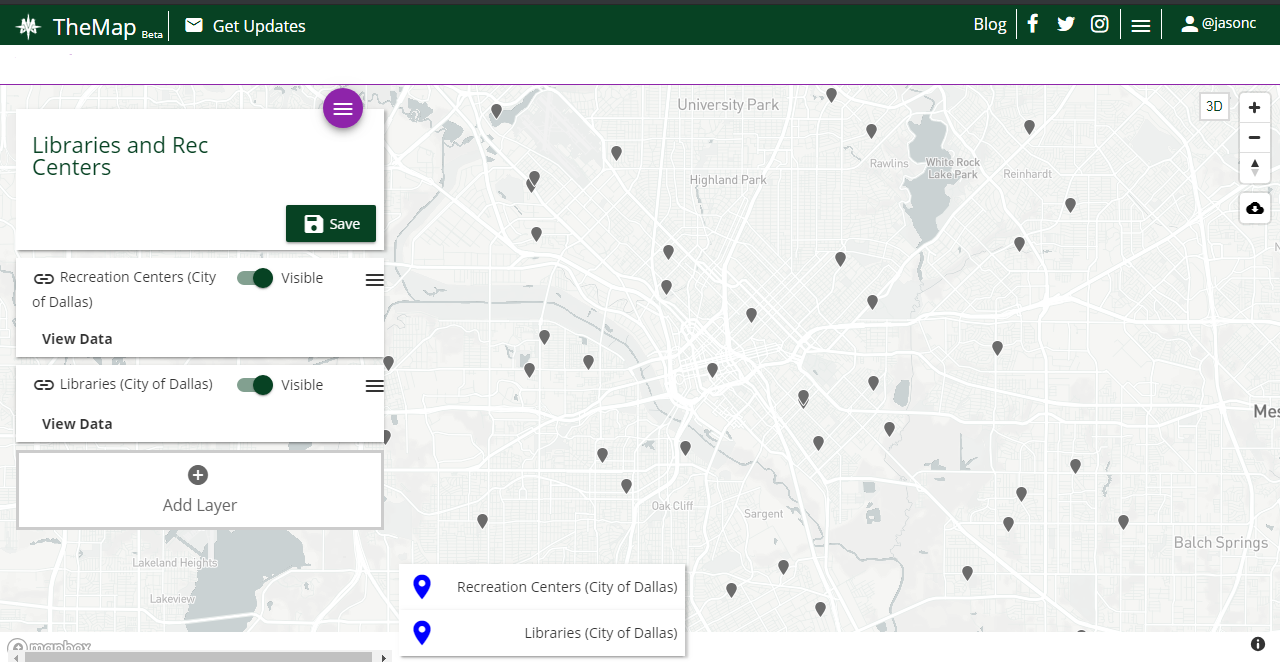
Let’s say I want to see the locations of libraries and recreation centers. People considering a move to Dallas may enjoy both of these placs and want to live near them. See the screenshot of TheMap to see how it looks when you combine data sets.
Notice that recreation centers and libraries are shown on the left side. In the screenshot, they’re both toggled as being “Visible” in TheMap. You can toggle either of them on or off to show their exact locations. Or, you can click on each pin to gain further information.
Final Thoughts on TheMap
Robert Mundinger has done a great, free public service to the city of Dallas. City officials should be using TheMap before they make decisions that will affect the residents of the city. For example, a new police station can be built near an area of high crime.
Dallas isn’t the only city that can benefit from using TheMap. Mundinger, or people inspired by him, can take this idea and apply it to virtually any city. It would all be in the name of improving the lives of residents over an extended period of time.
Featured photo by Aksonsat Uanthoeng on Pexels
TheMap photos are screenshots by RPS Relocation

Oct
Uhaul Prices Are Wildly Different Between Dallas and San Francisco
Jason C. 0 comments Dallas, Moving News

Prices for the same goods and services are not normally far apart; however, prices in some areas of the country are vastly more expensive than elsewhere. Case in point: The cost of living in California is generally more than it is in Texas. This is true for home prices, child care, medical care, and even the price of renting a Uhaul.
Uhaul prices are vastly different in the two states, actually. KXAN—a Texas news outlet—wanted to dig a little deeper regarding this disparity in their article “Why it’s 4x as much to rent moving truck from CA to TX than reverse“.
Examining the Prices
You can already see from the article title that prices for Uhaul rentals are more expensive in California. Chris Davis—writer of the article—shared that KXAN used Uhaul’s online estimate tool to determine price differences between renting a vehicle from San Francisco to Austin, and back.
Chris writes, “The cost to get a 26-foot truck (enough to move a house full of stuff) to San Francisco from here is $1,150; the reverse trip costs close to four times as much, at $4,380. The cost from Los Angeles to Austin is almost five times as much.” These prices are a factor to people considering a move to Los Angeles from Austin or from Austin to Los Angeles. It’s the same factor as with people moving from San Francisco to Dallas, as shown above.
When we checked on October 29th, 2018 here’s what the prices looked like:
San Francisco to Dallas
- 10 foot truck: $2,031.00
- 15 foot truck: $2,138.00
- 20 foot truck: $3,206.00
- 26 foot truck: $4,275.00
Dallas to San Francisco
- 10 foot truck: $974.00
- 15 foot truck: $1,026.00
- 20 foot truck: $1,128.00
- 26 foot truck: $1,282.00
We were able to determine that prices for Boston, MA, which is roughly as far away from Dallas as San Francisco (Boston is 1,768 miles away vs. San Francisco at 1,732 miles away), are much cheaper. Currently a 26 foot UHaul truck from Boston to Dallas is $1,797 or $2,478 less expensive than moving to Dallas from San Francisco with the same UHaul truck.
Why is there such a difference in prices? KXAN reached out to Uhaul for an explanation. They didn’t get a breakdown; however, KXAN received an indication why there are such large price differences. Chris writes, “U-Haul did not provide anyone for an interview about the price difference but told KXAN in an emailed statement that supply and demand plays a big role in how much it costs to get from place to place.”
I suppose the question is this: Why is the demand so high for Californians to move to Texas? Texas Senator Ted Cruz thinks he has the answer.
Ted Cruz’s Theory and Migration of the California Population

Senator Cruz is currently running for reelection in Texas. His opponent, Robert Francis “Beto” O’Rourke, is advocating for policies similar to those that can be found in California. Cruz, on the other hand, wants to preserve many of the policies that Texas currently has as well as move in a more conservative direction.
Senator Cruz is “advocating for low taxes and low regulation, comparing Texas to California, when he said the Golden State is “hemorrhaging population”. It’s widely known that the cost of living is higher in California, taxes are higher, and there is more regulation on businesses and markets.
Whatever the motive for UHaul’s pricing, the official numbers do prove people are leaving from California and migrating to Texas. Chris writes, “Texas gained more than 1,000 people per day again last year, according to U.S. Census Bureau statistics released at the end of 2017, a population gain of 1.4 percent. Most of those were what the agency calls a “natural increase” — babies being born — but 189,580 people migrated here, a total of 79,163 from other states. California, meanwhile, lost a net of 138,195 people to other states last year, though international migration still boosted the state’s overall population.”
It’s not just Texas either. When we look at UHaul prices for moving away from the bay area to cities in a similar distance away from San Francisco we see similar pricing for renting their trucks. Here are prices and distances for other cities in Mid-America roughly the same distance from San Francisco.
26 foot UHaul truck
- Kansas City, MO (1,803 miles away): $4,277.00
- Oklahoma City, OK (1,627 miles away): $4,100.00
- Omaha, NE (1,665 miles away): $4,245.00
- Minneapolis, MN (1,974 miles away): $3,671.00
Perhaps Ted Cruz is right and high taxes and a high cost of living are a couple reasons why people are moving from California to Texas and why the cost of moving via UHaul out of San Francisco is so expensive. However, the data seems to show that just like living in San Francisco, leaving it will cost you a lot, no matter when you’re going.
Have you ever rented a vehicle from Uhaul? If so, head over to our reviews page and rate them! We’re curious what you have to say.
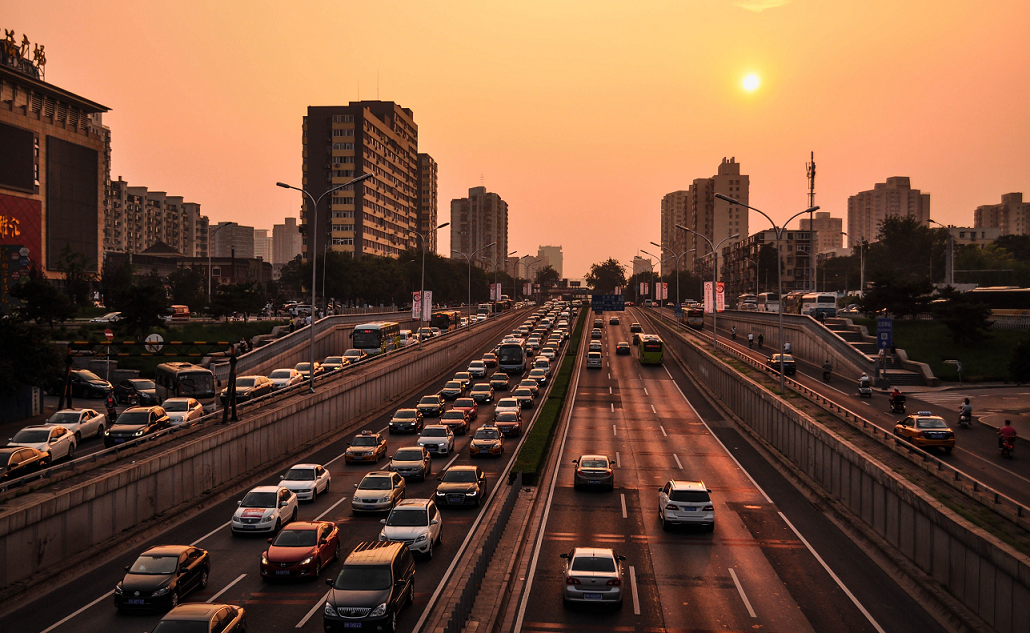
Featured photo by Bruce Mars and highway vehicles photo by Markus Spiske on Pexels

Oct
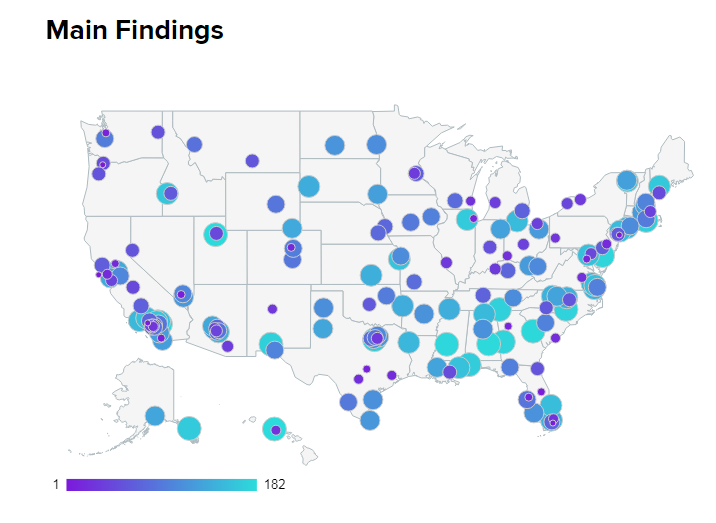
Some cities are better than others when it comes to food. More specifically, some cities are better for “foodies”. Foodies are those who explore new flavors and learn about different types of foods. WalletHub put together a comprehensive list of the best cities in America for foodies. They ranked the top 182 cities, to include the 150 most populous. Let’s explore some of these cities more in detail.
The Top 25 Cities
Topping the list is Portland, Oregon. Portland is well known as a “hipster haven” whose residents reach for the authentic. That includes food. Voodoo Donuts, Moonstruck Chocolates, Salt & Straw Ice Cream—theses are some of the food establishments Portland is known for.
The top 35 cities are as follows:
- Portland, OR
- San Francisco, CA
- Miami, FL
- New York, NY
- Los Angeles, CA
- Orlando, FL
- Las Vegas, NV
- Seattle, WA
- San Diego, CA
- Austin, TX
- Atlanta, GA
- Tampa, FL
- Chicago, IL
- Denver, CO
- Washington, DC
- Sacramento, CA
- Philadelphia, PA
- Houston, TX
- Oakland, CA
- Charleston, SC
- San Antonio, TX
- Cincinnati, OH
- Richmond, VA
- Milwaukee, WI
- Fort Lauderdale, FL
- Honolulu, HI
- Pittsburgh, PA
- Santa Ana, CA
- Albuquerque, NM
- St. Louis, MO
- Dallas, TX
- Rochester, NY
- Louisville, KY
- Minneapolis, MN
- Tucson, AZ
California and Texas: The States for Foodies
Of the 182 best cities for foodies, Califonia has 29 of them and Texas has 16. Granted, those two states are the two largest in the country, population wise. California is known for In-N-Out and avocado toast while Texas is known for Texas BBQ, Tex-Mex, chicken fried steak, and Texas chili. These famous food options are extremely simplified and one can find all types of lesser-known delights in these states and others.
While some Texans won’t be surprised at how well Austin and Houston ranked, they might be confused by Dallas ranking #31 on the list well after San Antonio and even lower than Albuquerque, NM. Ouch.
How These Cities Were Chosen
Adam McCann writes, “In order to determine the best and cheapest local foodie scenes, WalletHub compared 182 cities — including the 150 most populated U.S. cities, plus at least two of the most populated cities in each state — across two key dimensions, “Affordability” and “Diversity, Accessibility & Quality.”
Having these dimensions is important for a few reasons. With affordability, it was important for WalletHub that the food be accessible to the general population. For example, not everyone can afford a $100 meal, even if the taste is out of this world. Affordability doesn’t negate the lack of quality; instead, having affordable, quality food strikes a balance. The diversity of food within a city touches on the exploratory aspect of a city being known as a foodie haven.
Other Considerations
Cost of groceries, average alcohol prices, restaurants per capita, and coffee shops per capita are among additional factors that were taken into consideration.
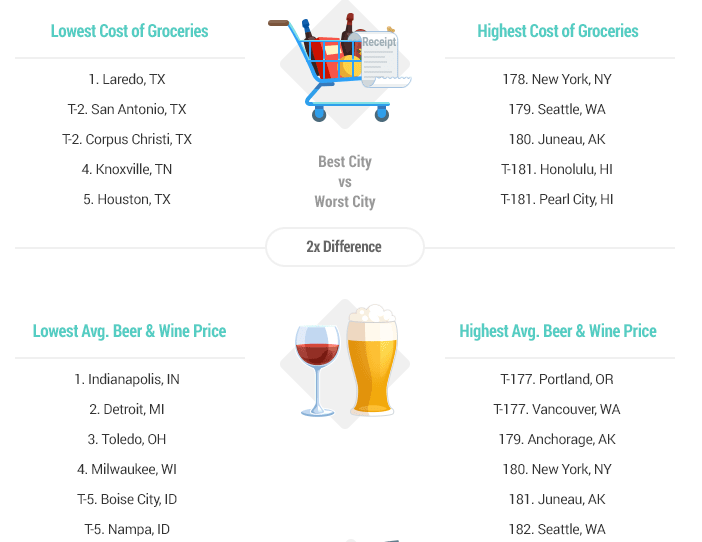
Texas has 4 of the top 5 cities—Laredo, San Antonio, Corpus Christi, and Houston—for the lowest priced groceries. The other city is Knoxville, TN. For the highest-priced groceries, the cities from the list consist of New York, NY, Seattle, WA, Juneau, AK, Honolulu, HI, and Pearl City, HI.
Alcohol is cheapest in Indianapolis, IN, Detroit, MI, Toledo, OH, Milwaukee, WI, Boise City, ID, and Nampa, ID. It’s most expensive in Portland, OR, Vancouver, WA, Anchorage, AK, New York, NY, Juneau, AK, and Seattle, WA.
What’s striking here is that while Portland is number one on the list, alcohol is the most expensive in the city. Portland also has the highest number of breweries per capita which is something WalletHub also took into consideration.
Featured photo by Chan Walrus on Pexels
Map photo and best groceries photos are screenshots by RPS Relocation

Oct
Dallas City Bond Projects Map
Jason C. 0 comments Dallas, Maps
The size of Texas is massive and the entire southeastern part rests on the Gulf of Mexico. Cities like Corpus Christi, Galveston, and Houston have felt the wrath of hurricanes. Given the central location of Dallas, one might assume flooding isn’t a major issue; however, it has been at times. To combat this, Dallas Reports detailed how the city is working on a number of flood prevention projects.
Projects in the Works
The projects are made possible from the passage of Dallas’s 2017 bond package. Specifically, these projects are covered under Proposition D. Jesus Jimenez of Dallas News writes “the city of Dallas has 84 projects in the works to improve flood protection, storm drainage, and erosion control.”
It’s important to remember that flood protection is only one aspect of minimizing potential damage to structures. Storm drainage and erosion control are equally important. For example, as an area takes on a large amount of water, there needs to be a mechanism in place for that water to be routed somewhere. Erosion control mitigates the instances of land, coastal, and construction disappearance.
Jesus Jimenez continues, “Sarah Standifer, assistant director of stormwater operations for the city of Dallas, said that while the last bond package sought to address citywide improvements, Proposition D of this bond package focuses on more neighborhood-specific improvements.” This tells me, without delving into the results of the last bond package, that citywide improvements were through to be sufficient. That’s why Dallas is now moving on to neighborhood-specific improvements. But which neighborhoods will be chosen? Let’s take a look at that next.
Dallas’ Flood Prevention Map
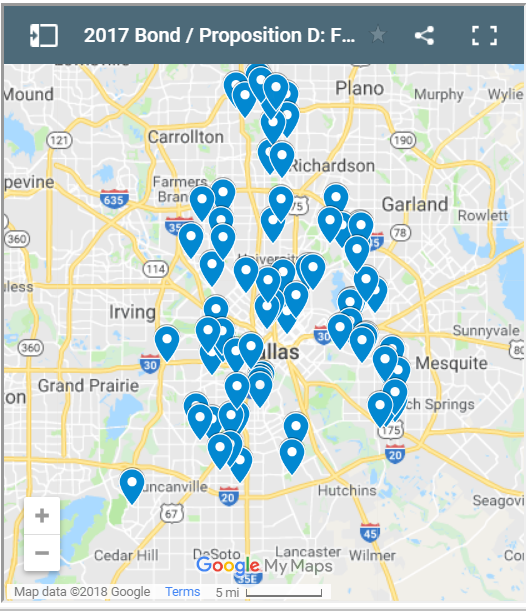
Google Maps has created a snapshot of areas where flood prevention projects are taking place. This map allows residents of Dallas access to track the progress of the ongoing projects.
Click on one of the blue pins to get a description of the work being done. For example, I clicked on Turnpike Distribution IV IH30-Commerce. The description says “Design and construction of connection of the improved channel in the Turnpike Distribution Center”. For another example, I clicked Teakwood Elmridge Drainage Relief. The description says “Design and construction – Replace existing system at the Teakwood and Elmridge area with a 100-year system.”
How Project Locations are Chosen
Do neighborhoods in and around Dallas get an equal amount of flood prevention aid? That’s not how it’s outlined in Proposition D. Jesus Jimenez writes “The process to identify projects funded through Proposition D included analyzing calls to 311, flood studies, community calls and emails, system inspection, and drainage master plans.”
This is the most logical way to determine which neighborhoods should get flood prevention aid. After all, places that have no history of flooding or aren’t vulnerable shouldn’t get chosen over places that have a history of flooding. Departments of the city keep records of areas that have been impacted by flooding. They use these records to determine which neighborhoods will be getting the flood prevention aid.
The decision rested with more than only what areas have flooded in the past. Jesus Jimenez continues, “Projects then went through a two-step evaluation involving technical criteria with a focus on public safety, and balancing criteria with a focus on supporting economic development and enhancing quality the of life.”
Economic development areas are just as important to keep safe as it is to keep neighborhoods safe. If business areas are wiped out, people may not be able to afford their homes; therefore, there has to be a balance between sending aid to neighborhoods and business areas.
Featured image by Pixabay on Pexels
Dallas city bonds projects map is a screenshot by RPS Relocation

Oct
Allergies—a health condition whereby the immune system is negatively impacted by foreign particles or substances—are a public nuisance. These substances can be found in cities across the nation; however, some places have a significantly higher amount than others.
The Asthma and Allergy Foundation of America (AAFA) conducted a comprehensive study to identify where allergies are the worst during the Fall season. The actually listed 100 cities, which you’ll see at the end of this article.
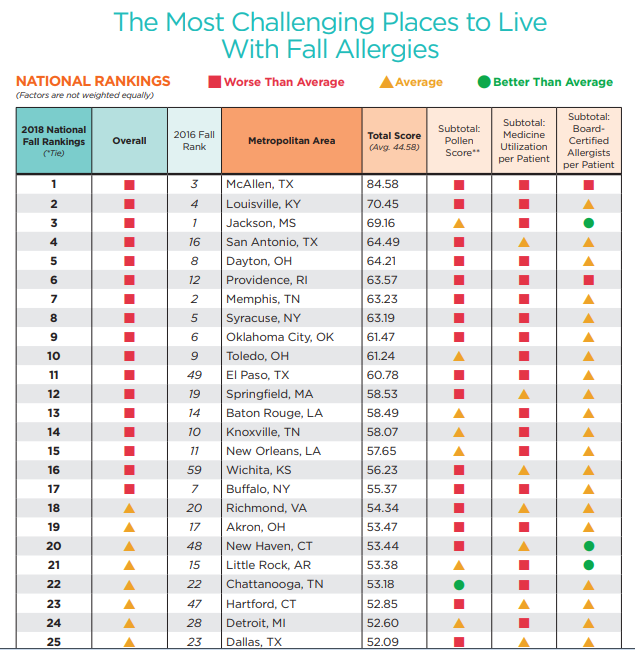
AAFA’s Criteria for Inclusion
How did the AAFA determine which cities made the cut, and which didn’t? They describe it in detail: “The ranking is based on analysis of data from the 100 most-populated Metropolitan Statistical Areas (MSAs) in the contiguous 48 states. The three (3) individual factors analyzed for the 2018 rankings are: seasonal (Fall) pollen score, medication use (allergy) and number of allergy specialists. For each factor, AAFA used the most recently available calendar year data. Weights are applied to each factor; factors are not weighted equally. Total scores are calculated as a composite of all three factors.”
Tips for Allergy Prevention
The AAFA provides actionable tips which will help you avoid or reduce your allergies. The recommend wearing sunglasses outdoors, removing shoes in the home, and keeping windows closed. If you have carpeting, regular vacuuming will reduce allergens in your home. Bed sheets should also be cleaned on a regular basis.
The AAFA also recommends “CERTIFIED asthma & allergy friendly” products such as cleaning supplies. You can also find allergy-friendly bed mattresses and HVAC filters. The more allergy friendly products you own, the better chance you have at mitigating the presence of allergies in your home.
The Top 100 Cities with Fall Allergies
The cities below are ranked from worst to best as the “most challenging places to live with fall allergies”.
- McAllen, TX
- Louisville, KY
- Jackson, MS
- San Antonio, TX
- Dayton, OH
- Providence, RI
- Memphis, TN
- Syracuse, NY
- Oklahoma City, OK
- Toledo, OH
- El Paso, TX
- Springfield, MA
- Baton Rouge, LA
- Knoxville, TN
- New Orleans, LA
- Wichita, KS
- Buffalo, NY
- Richmond, VA
- Akron, OH
- New Haven, CT
- Little Rock, AR
- Chattanooga, TN
- Hartford, CT
- Detroit, MI
- Dallas, TX
- Birmingham, AL
- Philadelphia, PA
- Columbia, SC
- Columbus, OH
- Tulsa, OK
- Greenville, SC
- Albany, NY
- Grand Rapids, MI
- 21 Cleveland, OH
- Pittsburgh, PA
- Charleston, SC
- New York, NY
- Scranton, PA
- Miami, FL
- St. Louis, MO
- Bridgeport, CT
- Austin, TX
- Allentown, PA
- Las Vegas, NV
- Omaha, NE
- Greensboro, NC
- Winston-Salem, NC
- Augusta, GA
- Virginia Beach, VA
- Cape Coral, FL
- Houston, TX
- Jacksonville, FL
- Fresno, CA
- Tucson, AZ
- Madison, WI
- Cincinnati, OH
- Nashville, TN
- Chicago, IL
- Rochester, NY
- Riverside, CA
- Charlotte, NC
- Indianapolis, IN
- Orlando, FL
- Des Moines, IA
- Los Angeles, CA
- Modesto, CA
- Lakeland, FL
- Minneapolis, MN
- Harrisburg, PA
- Kansas City, MO
- Albuquerque, NM
- Tampa, FL
- Durham, NC
- Worcester, MA
- Oxnard, CA
- Atlanta, GA
- Milwaukee, WI
- Baltimore, MD
- Bakersfield, CA
- Phoenix, AZ
- Boston, MA
- Palm Bay, FL
- Washington, DC
- San Diego, CA
- Spokane, WA
- Stockton, CA
- Daytona Beach, FL
- Sarasota, FL
- Raleigh, NC
- Sacramento, CA
- Salt Lake City, UT
- San Francisco, CA
- Ogden, UT
- Colorado Springs, CO
- Seattle, WA
- San Jose, CA
- Boise, ID
- Portland, OR
- Provo, UT
- Denver, CO
Featured image by Public Domain Pictures on Pexels
AAFA city allergies chart photo is a screenshot by RPS Relocation

Sep
One of the reasons people relocate is to chase an opportunity. Another reason is for them is to enjoy a heightened quality of life. The better quality of life may include lower crime, increased affordability, or a larger number of amenities offered by the city or local organization. MONEY, a division of Time Magazine, put together a list of the 50 greatest places to live in America. Here are their top ten picks:
- Frisco, Texas
- Ashburn, Virginia
- Carmel, Indiana
- Ellicott City, Maryland
- Cary, North Carolina
- Franklin, Tennessee
- Dublin, California
- Highlands Ranch, Colorado
- Sammamish, Washington
- Woodbury, Minnesota
Criteria to Make the List
The list—which features cities from all over the country—is governed by nine categories. They are:
- Economy
- Cost of Living
- Diversity
- Education
- Income
- Housing
- Crime
- Amenities
- Ease of Living
Having this many categories allowed MONEY to conduct a comprehensive analysis in support of their findings. In addition, they write “we looked only at places with populations of 50,000 or greater. We eliminated any place that had more than double the national crime risk, less than 85% of its state’s median household income, or a lack of ethnic diversity. This gave us 583 places.” Narrowing the criteria by these small factors meant that only 8.5% of cities would be chosen.
With regards to home prices, MONEY needed to find a partner with access to a database of nation-wide prices. So they teamed up with Realtor.com. Realtor.com—an online real estate broker—was the perfect answer to MONEY’s problem. The real estate broker was able to grant access to home prices in virtually every city across the country.
There are two places I’d like to focus on due to their close proximity to the cities we serve. Frisco, TX is near Dallas and Sammamish, WA is near Seattle. Let’s start with Frisco.
The Greatest Place: Frisco, TX

There’s another bonus to talking about Frisco, TX: It ranks number one on the list! Frisco excels in every category of criteria. MONEY writes Frisco is “a sleepy bedroom community of 6,500 people as recently as 1990, the city today houses around 180,000 residents. Jobs are projected to grow by nearly 15% over the next four years, according to Moody’s Analytics, and companies from T-Mobile to Oracle have offices in the city.” Here’s what this means: People are flocking to Frisco and there’s no indication its popularity will wane anytime soon.
Frisco is also a great place for growing families. Indeed, public schools in the city have “the highest graduation rate of all the cities and towns MONEY evaluated this year.”
A Tech and Outdoors Haven: Sammamish, WA
Sammamish also ranks very highly on the list, coming in at number nine. When people think about tech companies, they think “Silicon Valley” which is located in California; however, Sammamish “attracts many of the people who work for Microsoft, Amazon, Expedia and other tech giants.” Like Silicon Valley, the home prices are relatively expensive. But here’s the good news: salaries are relatively high as well.
Culture and recreational living flourish in Sammamish. The city has fourteen parks and nature preserves which are populated by diverse wildlife. Sammamish is also home to regular concerts and exhibitions.
Take a look at other places on the list. If you’re interested in relocation anywhere, make sure you use our form to get a free moving quote.
Featured image by Pixabay on Pexels
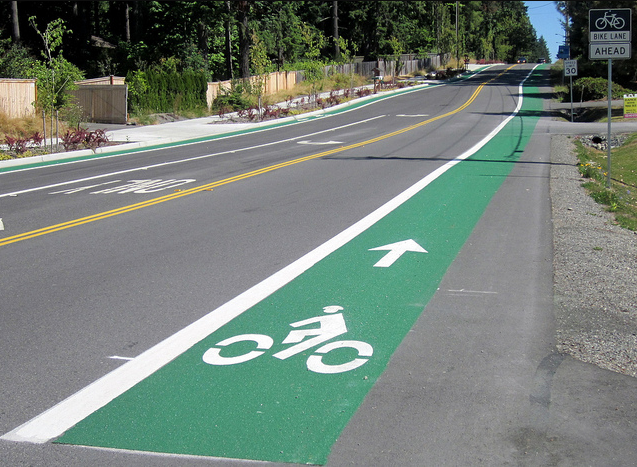
Farmers market and bike lane photos are screenshots by RPS Relocation
Aug
How Much Time Residents Of Major USA Cities Waste Commuting In Their Lifetime
Jason C. 0 comments Dallas, Data Visualization, Maps, Seattle
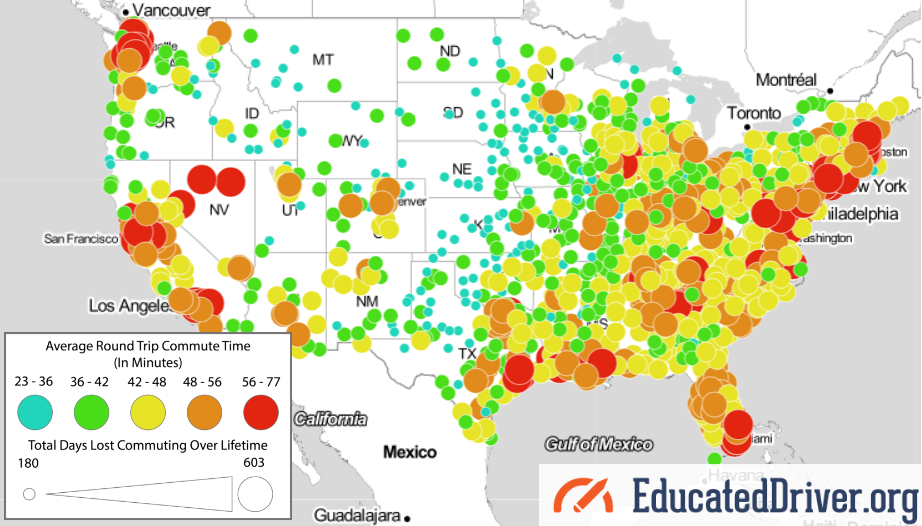
How much time do you spend driving? If you live in or near a major city, the answer is probably “a lot”. EducatedDriver.org has put together a data visualization map which details the average round trip commute time that may affect you.
Alex Lauderdale, the author of the article, writes “We did the math for nearly 1,000 US cities. The average American loses 408 days of their life commuting, and in many areas, the toll is even higher.” Let’s dig a little deeper and look at some individual cities listed.
Here’s How Much Time You’ll Waste Commuting in Your Lifetime (by City)
The Cities We Serve
Here at RPS Relocation, we focus on offering a great relocation experience in Dallas, Seattle, Las Vegas, and Boulder; so we’ll use them as examples. What is the average commute time like in each of these cities? We’ve sorted them from worst to best, starting with Seattle which is the worst on this map.
Seattle, WA — Seattle has one of the worst average round trip commute times in the country. If you look closely at the visualization, the city is marked by a red circle which stands for the longest commutes. Indeed, a commuter in Seattle will spend 463 days of their life on the road. The average round trip commute time is 59.2 minutes.
Dallas, TX — Dallas is orange on the map, which is one step better. A commuter in the city will lose 436 days of their life by driving in or around it. The average round trip commute time in Dallas is 55.8 minutes. Dallas must have just missed being in the red due to its close proximity to the commuting times Seattle drivers have to deal with.
Las Vegas, NV — Las Vegas, like Dallas, is also in the “orange zone”. A commuter in Sin City will spend 381 days of their life on the road. The average round trip commute time in Las Vegas is 48.8 minutes.
Boulder, CO — Out of the four cities, drivers in Boulder have it the best. The city is right in the middle when it comes to average commute times. The area is marked by a yellow circle. A driver in Boulder will lose 350 days of their life to commuting. That’s just under one year! The average round trip commute time in Boulder, CO is 44.8 minutes.
Other Major or Growing Cities
Major cities in red on the visualization map seem to be the largest in the country. Many of the ones in yellow seem to be growing or up-and-coming cities. Austin, Charlotte, and Denver come to mind. For the remainder, take a glance at where these cities stand with regards to the average round trip commute time. The number after each city is the round trip time in minutes.
Red Circle
New York 71.8
Washington D.C. 68.8
Chicago 64.4
San Francisco 64.2
Boston 64
Philadelphia 63
Miami 61.2
Los Angeles 60.8
Houston 59
Orange Circle
San Jose 54.6
Denver 54.6
Nashville 54
Detroit 53.4
Austin 52.8
Jacksonville 52.6
Charlotte 52.6
Portland 52.4
Phoenix 52
San Antonio 51.4
San Diego 50.6
Yellow Circle
Kansas City 45.8
Oklahoma City 44.8
Featured photo by Pixabay on Pexels
EducatedDriver.org data visualization map photo is a screenshot by RPS Relocation

Aug
Parts of Dallas are getting hotter over time and it’s largely due to human actions. I’m not talking about climate change or other atmospheric alterations. Instead, trees are being cut down as a result of continuous urban development.
There are a host of problems that develop as a result of removing a large number of trees. One is that healthy oxygen levels would decrease since trees emit the compound. Trees also absorb unhealthy compounds such as carbon dioxide which is commonplace in urban areas. Still, another issue with removing trees is the lack of shade, especially in areas around Dallas.
Citilab detailed how Dallas-area residents have gotten tired of the growing “heat islands” and have begun fighting back.
The Planter Organizations
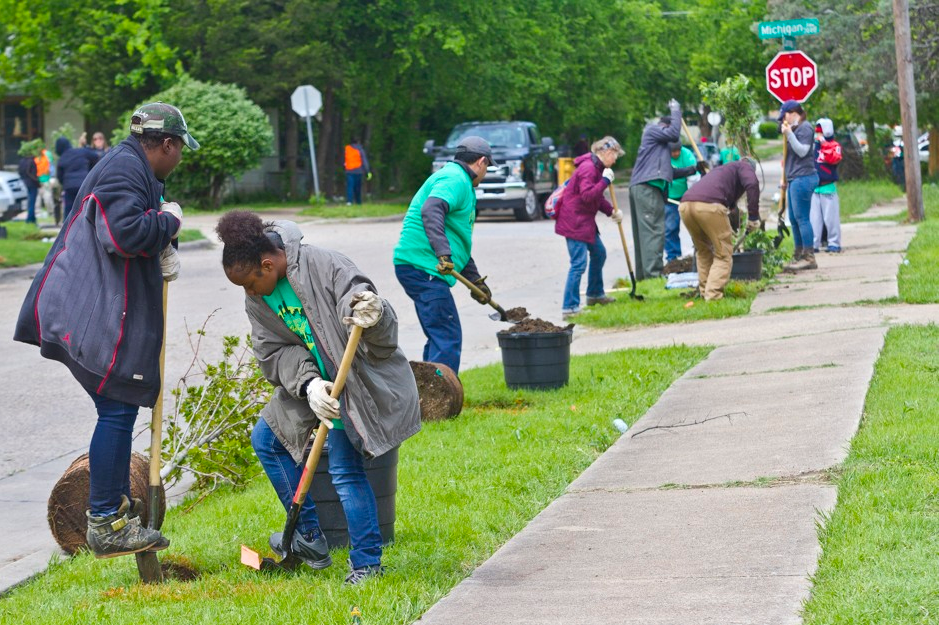
The residents have banded together under the banner of three different organizations: Texas Trees Foundation, The Nature Conservancy, and Trust for Public Land. Each of these groups plays a part in restoring trees in various neighborhoods. And there’s one neighborhood in particular that needs an added level of attention: Oak Cliff.
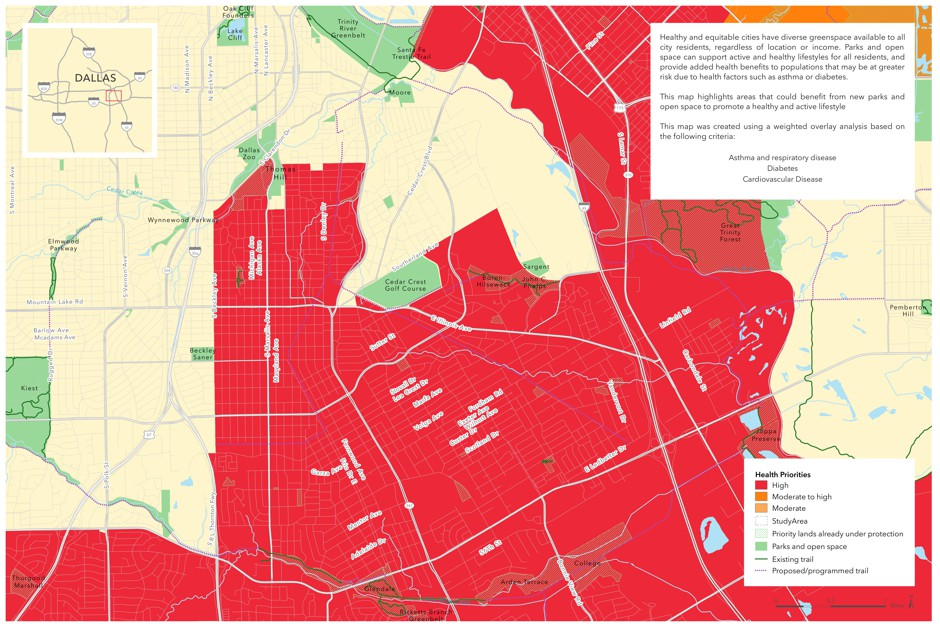
Oak Cliff, as seen in the map below, is a high-risk neighborhood for heat-related problems. Asthma, diabetes, cardiovascular disease—these are common health consequences of living in a poor environment.
“The goal is to eventually plant 1,000 trees; so far, some 500 saplings are in the ground as part of a project called Cool and Connected Oak Cliff. Planting trees is a common low-tech solution to battle the heat island, but high temperatures are just one target of this ambitious project.”
Planning the Habitat
The Texas Trees Foundation originally used aerial imagery to map where the trees were around Dallas. They studied different neighborhoods and found temperature differences in areas with trees versus those without. This was noted in their “report on urban heat management in the city, which suggested that trees could help curb temperatures by as much as 15 degrees on hot days”.
The Trust for Public Land did their part with the data as well. They ran it through a “visual mapping program, overlaying the numbers with additional data on the socioeconomic and health status of Dallas’s neighborhoods.”
Side Benefits of More Trees
Cleaner oxygen is only one benefit of living around many trees. Others include shade for playgrounds and places with high foot traffic. Trees foster an increase in the safety of pedestrians who walk near roads. Robert Kent at the Trust for Public Land says “not only provides a physical barrier of separation, but the tree will also be a signal to drivers to slow down”.
Future Goals
Cool and Connected Oak Cliff has already surpassed half of their goal; however, planting 1,000 trees is only a drop in the ocean. “The Texas Trees Foundation’s report suggests that the city will need to increase its tree canopy by about 5 percent to make a dent in curbing the heat island effect. That can mean roughly 300,000 trees.” That being said, the positive results from the new, growing trees may prompt more calls to grow even more trees.
Featured photo by Anton Atanasov on Pexels
Oak Cliff map and tree planters photo are screenshots by RPS Relocation

Jul
Millennial Movers are heading to Washington and Texas in droves
Jason C. 0 comments Dallas, Moving News, Seattle
Birds of a feather fly together. The same can be said of Millennials. That’s because they are flocking to the same cities around the country in large numbers. Now, we have hard data of where they’re moving to, courtesy of SmartAsset. As you know from the title, Millennials are moving to Washington and Texas. Where else are they moving to? Keep reading to find out!
Top Ten States
We listed Washington and Texas specifically because they are the top two states Millennials are moving to. Here’s the full list:
- Washington – 39,590
- Texas – 33,650
- Colorado – 26,547
- Virginia – 18,338
- Georgia – 17,621
- Oregon – 11,989
- North Carolina – 9,647
- Nevada – 8,820
- Florida – 7,195
- Arizona – 7,077
And there you have it. These are the most popular states that Millennials are migrating to. The number to the right of the state indicates net migration.
Why are Millennials moving to those states? And why are they moving away from cities like Chicago and New York? Jobs, housing, and the cost of living are among the biggest reasons. Business is booming in states like Texas and in cities like Dallas/Fort Worth, for example.
Methodology of the Data
Where did the data come from? Derek Miller of SmartAsset writes, “In order to calculate which cities and states millennials are moving to, SmartAsset compared 2016 Census Bureau migration data for 217 cities and all 50 states, plus Washington, D.C. We compared the number of persons between the ages of 20 and 34 who emigrated from each city and state to the number who immigrated. We ranked the cities and states by highest difference between the number who immigrated and the number who emigrated for persons ages 20 to 34.”
And there you have it. The data comes from the Census Bureau which is probably the best place to get it from. The ages of between 20 and 34 are the target ages for Millennials which proves that the data has merit. Furthermore, the use of migration data for 217 cities shows that the study is a comprehensive one.
Unless cities like New York and Chicago take action to attract Millennials, those cities will eventually get smaller if people came moving away from them.
Featured photo by StockSnap on pixabay
Most Recent Blog Posts
 A Dallas Area Home Buyer Had to Pay $300,000 More Than Asking Price For Their New Home22 May, 2021
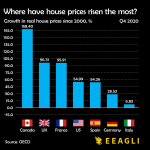
- Canada's Home Prices Have Risen 168.4% Since 2000, USA Home Prices Have Risen 54.99%01 Apr, 2021
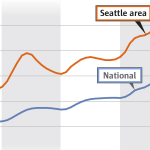
- Home Prices in Seattle Are Skyrocketing12 Mar, 2021
- Seattle Among Best Cities for Startups08 Jul, 2019
- Renters in Chicago and New York are fleeing south for Dallas24 Jun, 2019